Historical flood occurrence
Inspired from Dr. Ate Poortinga’s work in extracting water occurrence from satellite image, I tried to do similar analysis to get historical average of flood occurrence by month. The result from this analysis will be added as a probability information to enhance WFP’s VAMPIRE flood alert system (Extreme rainfall-triggering flood) that currently I am working on.
The steps below describe how to extract monthly water occurrence and seasonality water using Google Earth Engine code editor.
Step 1. Define geographic domain
Step 2. Import JRC Global Surface Water and extract permanent water from Seasonality layer
Step 3. Define study period (example: extract January data from 1984 - 2018)
Step 4. Detect all observation data with water
Step 5. Calculate flood occurrence
Step 6. Visualisation and add map to canvas
Step 7. Export the result to Google Drive
Step 8. Setting legend
[caption id=“” align=“alignnone” width=“2500”]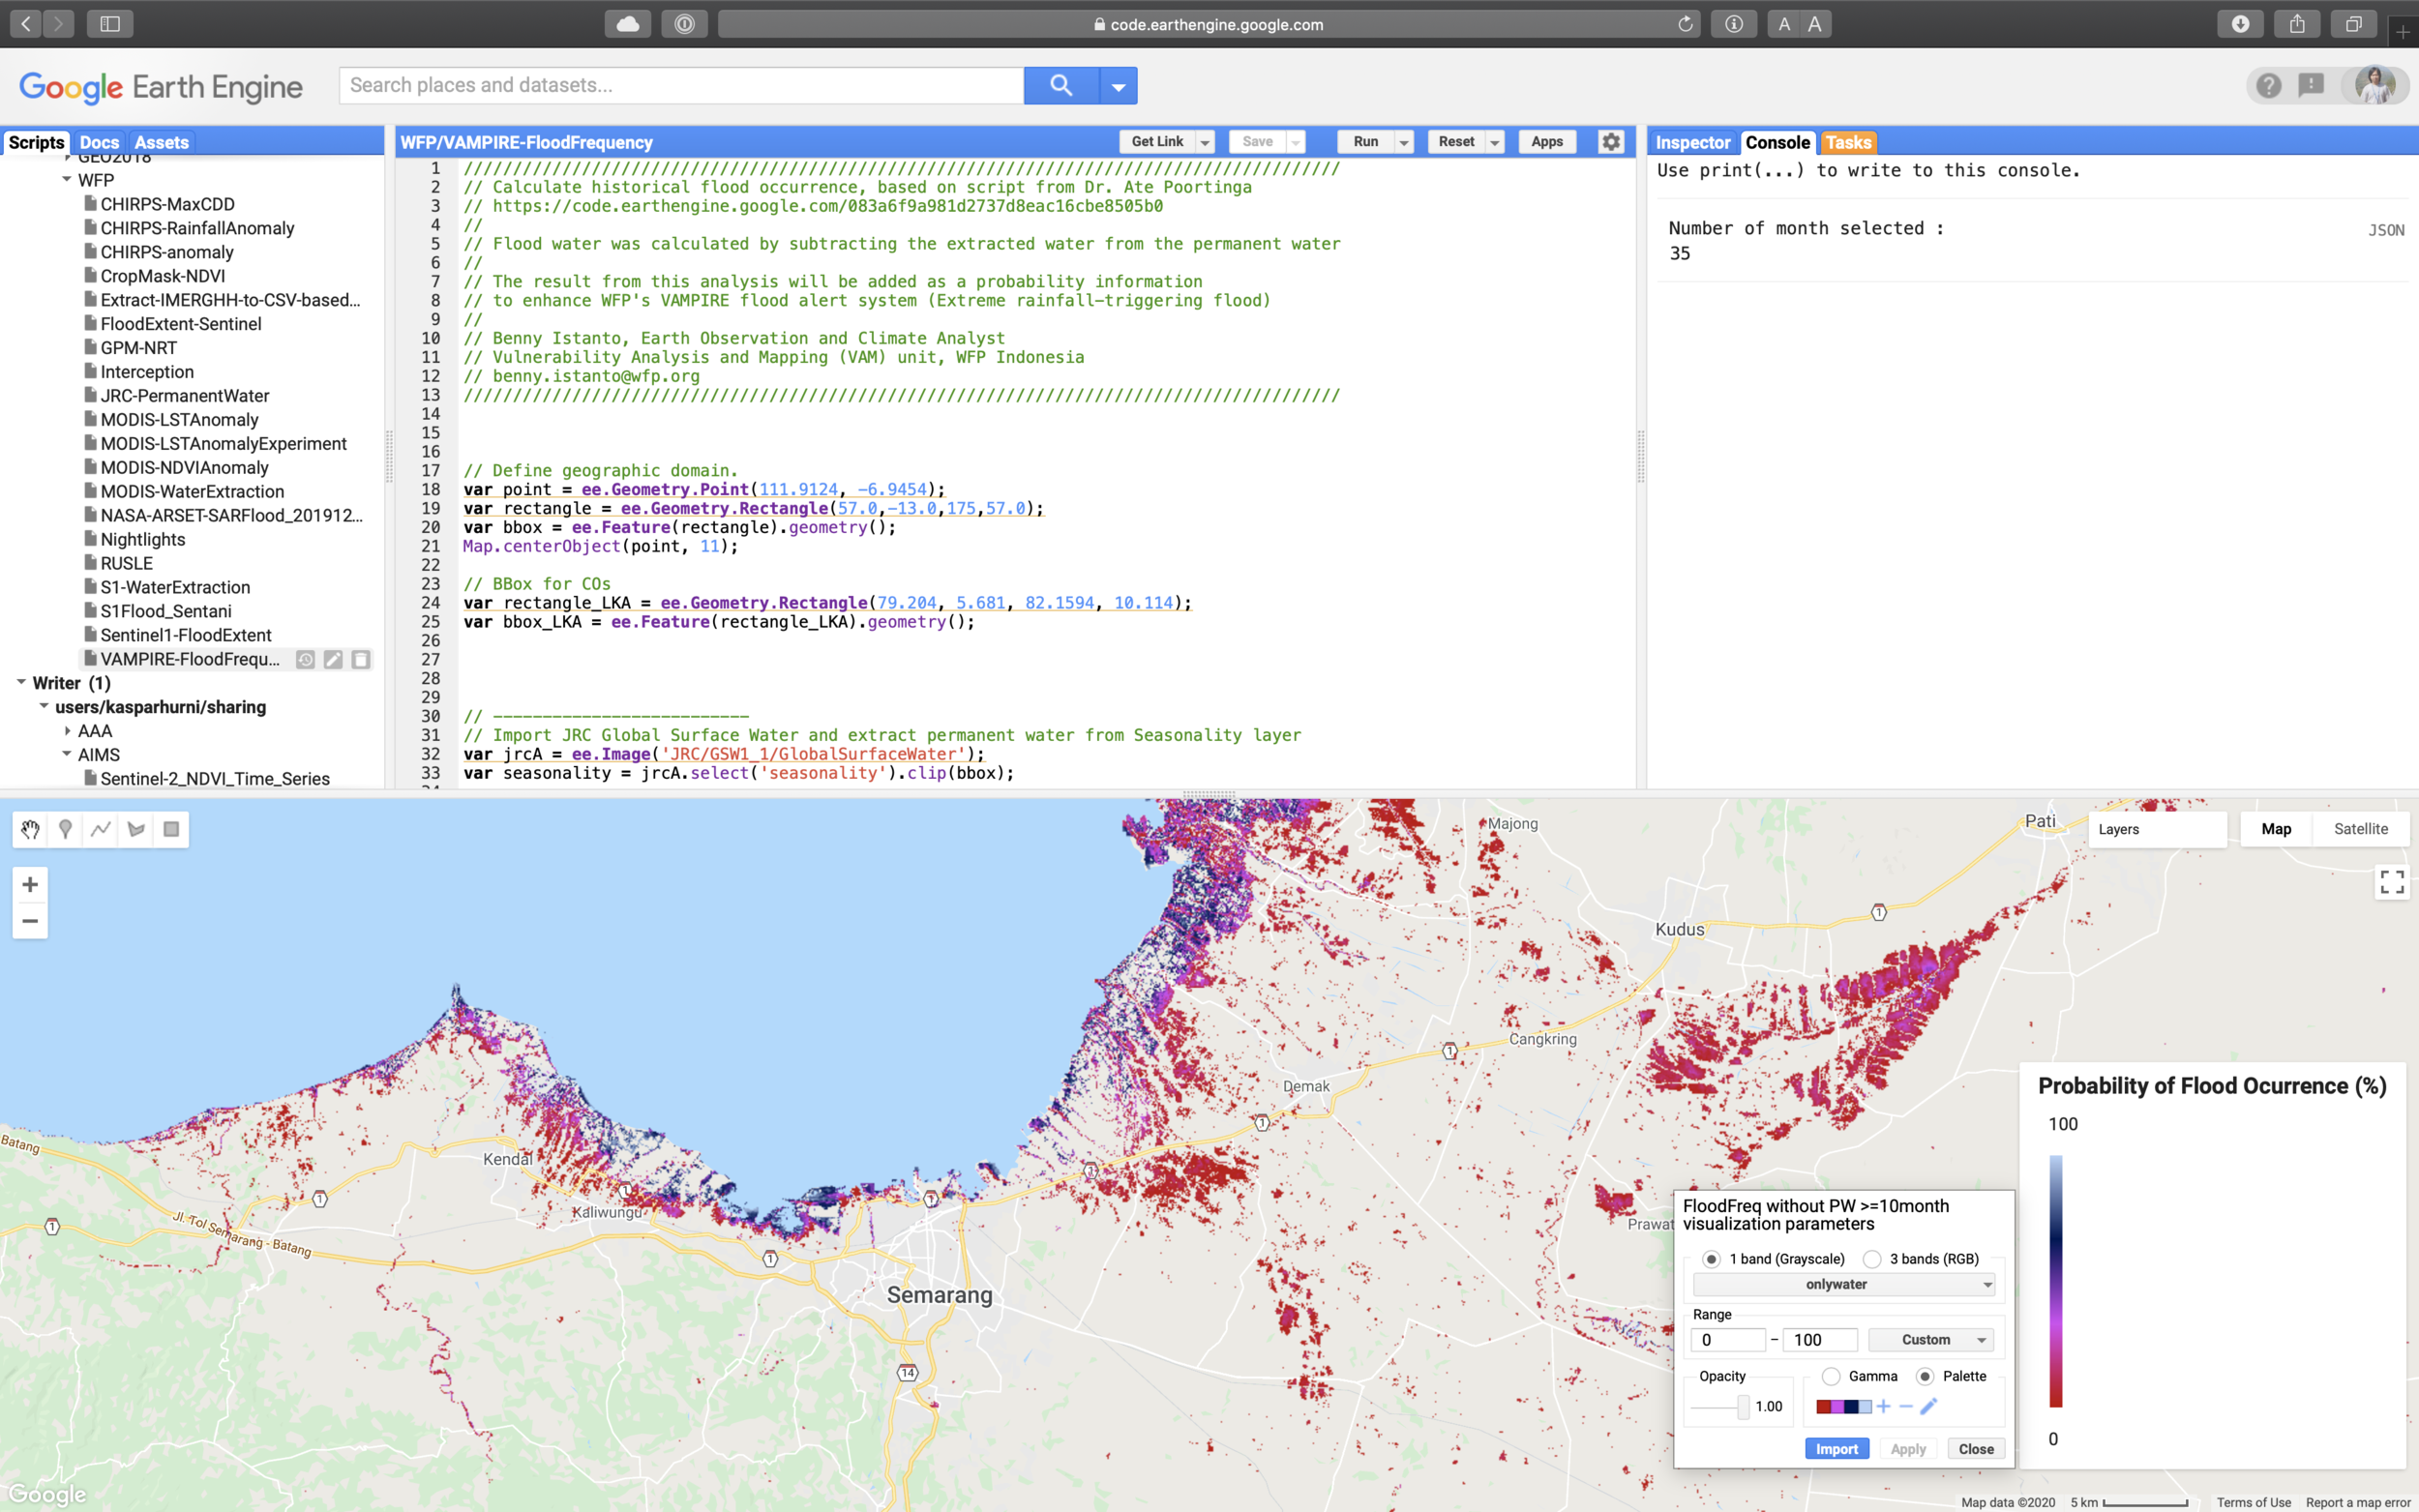 Figure 1. Google Earth Engine user interface [/caption]
Full script here
Back to top