Monthly weather data from ERA5 and FLDAS
Since 2015, considerable amount of new data (high resolution satellite-based product combined with social media data) developed using new technology through artificial intelligence (machine learning, computer vision, etc.) available for public, but further utilisation remains lack.
Now in cloud computing era, we can easily get instant access to massive weather and climate data and do processing from the browser via Google Earth Engine platform.
Let’s try to access monthly weather data from NASA and ECMWF:
- https://developers.google.com/earth-engine/datasets/catalog/NASA_FLDAS_NOAH01_C_GL_M_V001
- https://developers.google.com/earth-engine/datasets/catalog/ECMWF_ERA5_MONTHLY
Import above data from EE Data Catalog
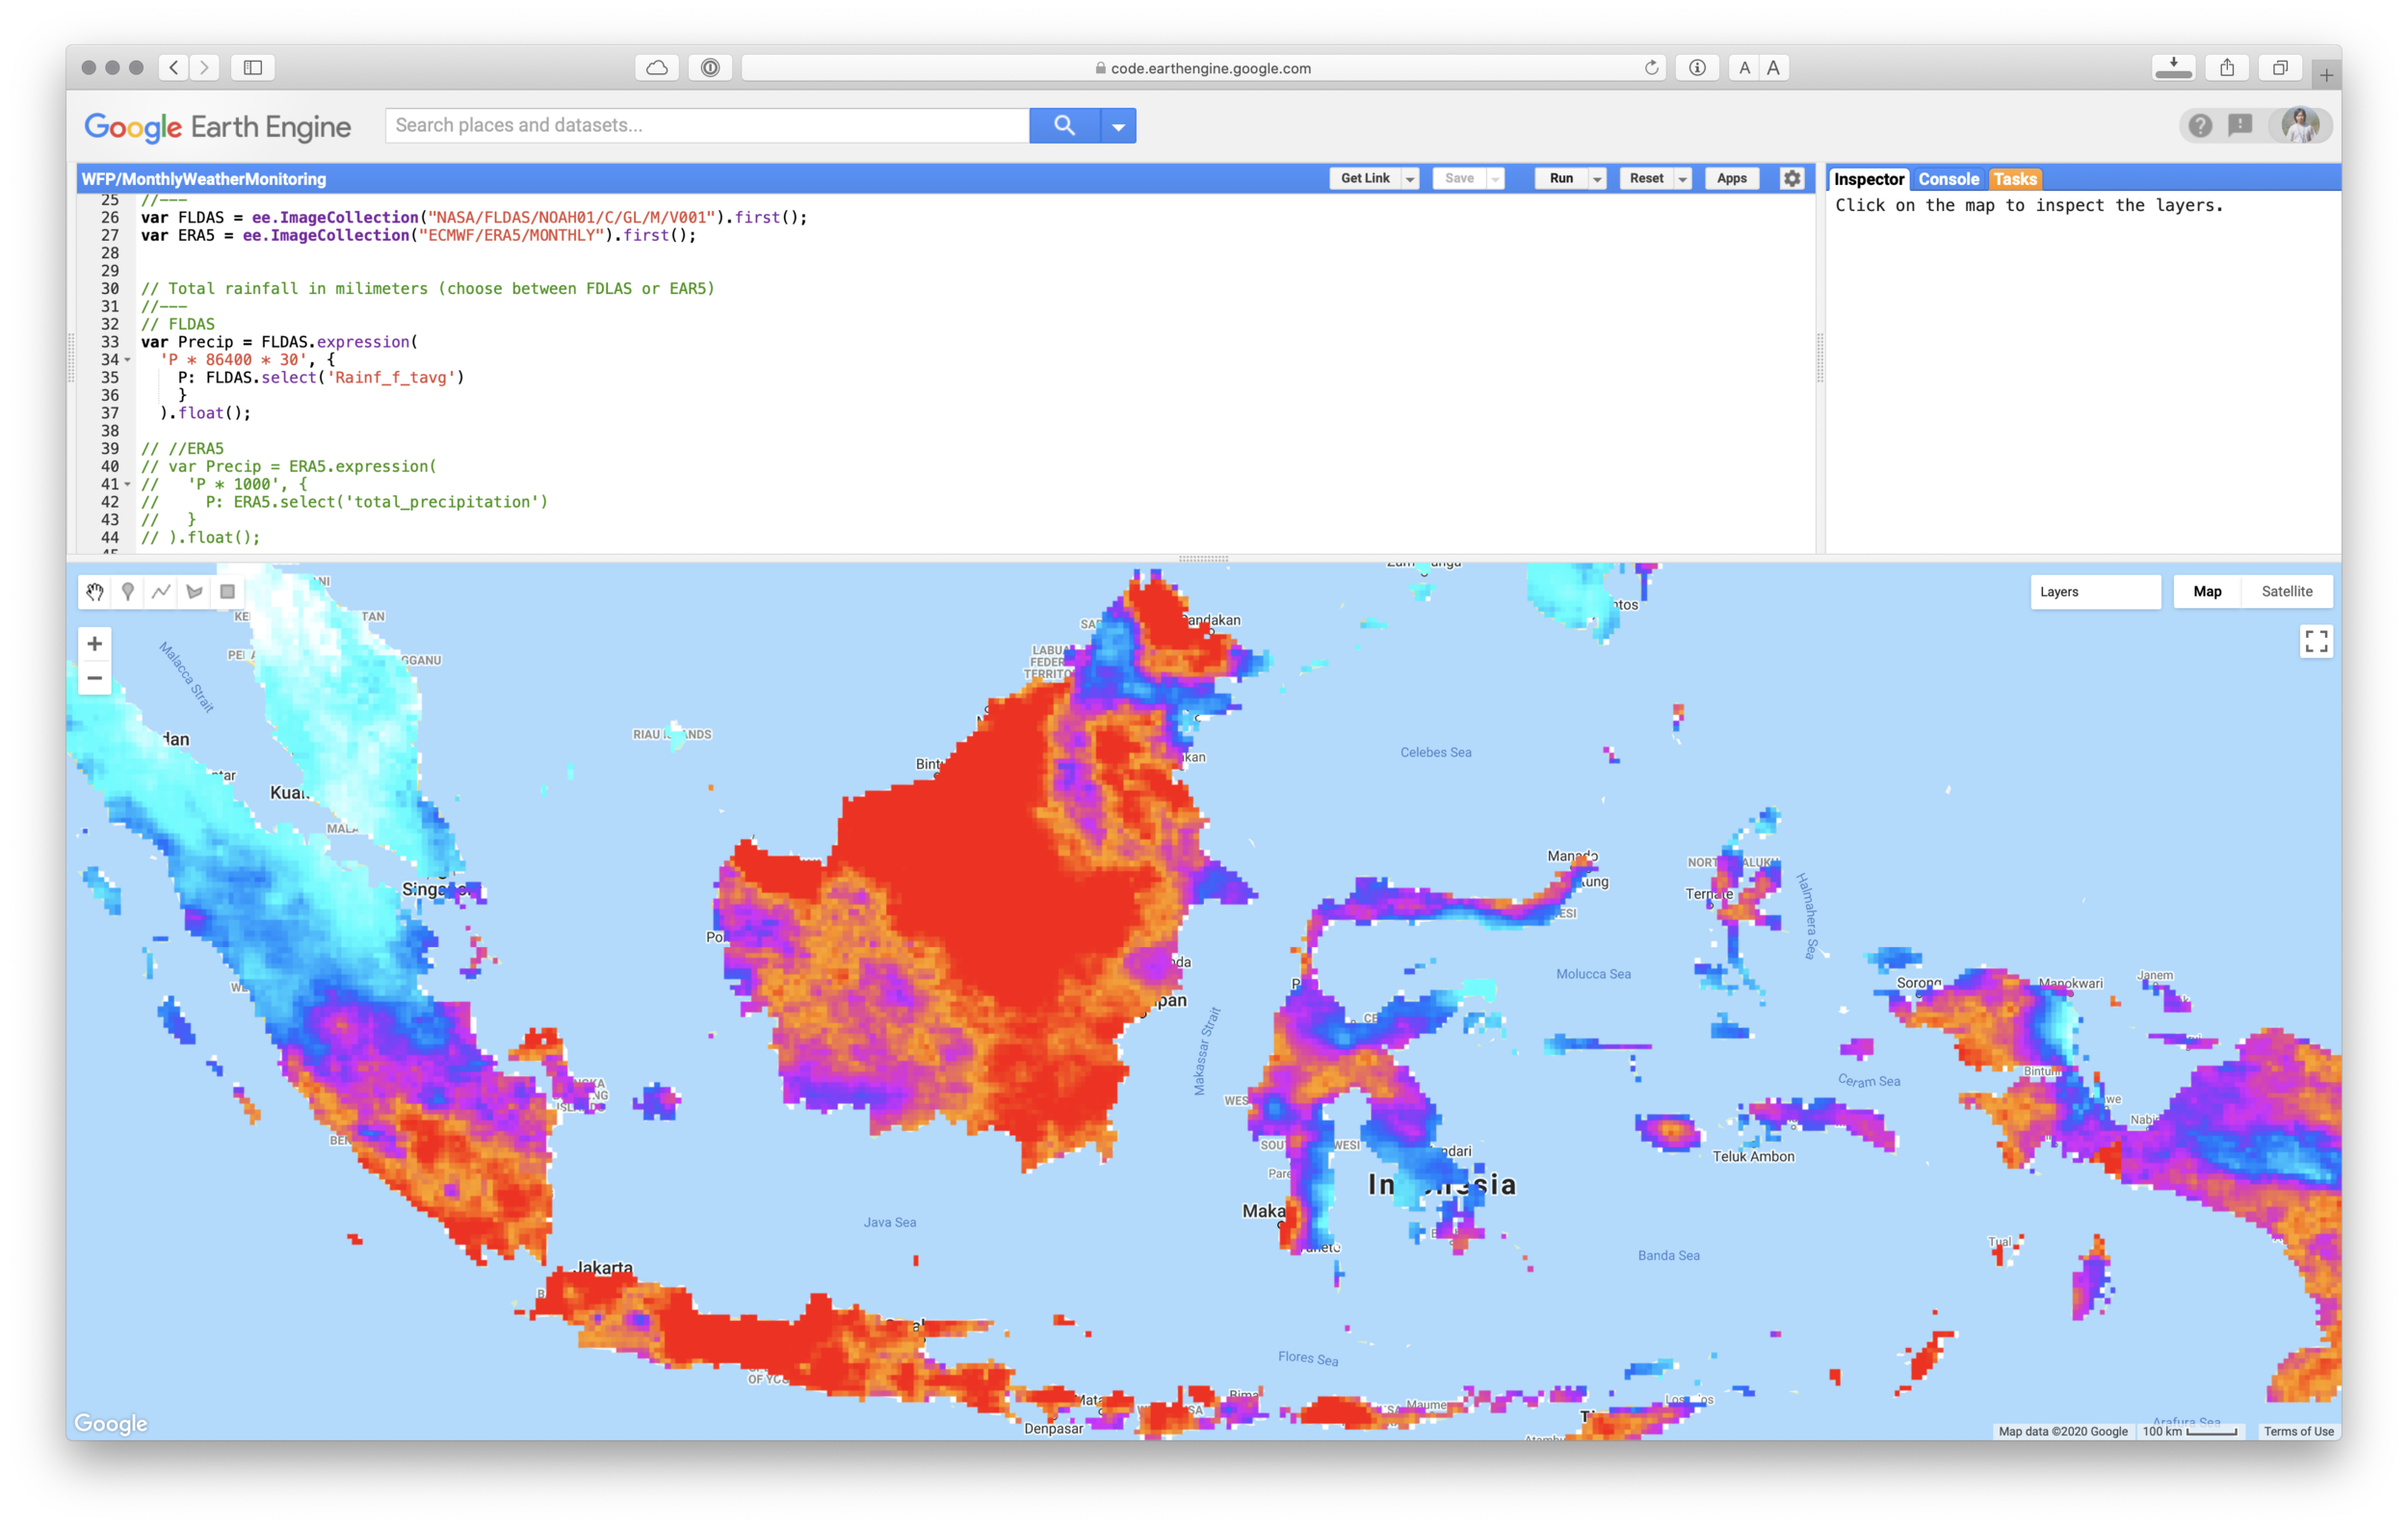
Access the precipitation data, visualise it and add to the map layer
- Precipitation unit in FLDAS data: “kg m-2 s-1”, is the International System of Units (SI) used for precipitation. While 1kg = 1Liter = 10e6 mm3 and 1m2 = 10e6 mm2. Therefore 1kg of rain over 1 m2 is equivalent to 1mm.
- Multiply the rate (given in kg m-2 s-1) by 1 to get the rainfall in terms of mm/second. Or multiply the value by 24*60*60 to get the total rainfall in mm per day. 1 kg/m2/s-1 = 86400 mm/day
- For the monthly value, daily value can be multiplied by the number of days e.g. 86400 x kg/m2/s x number of days in a month (28/29/30/31).
- Precipitation in ERA5 data is in m, so we need to multiply it by 1000 to get mm.
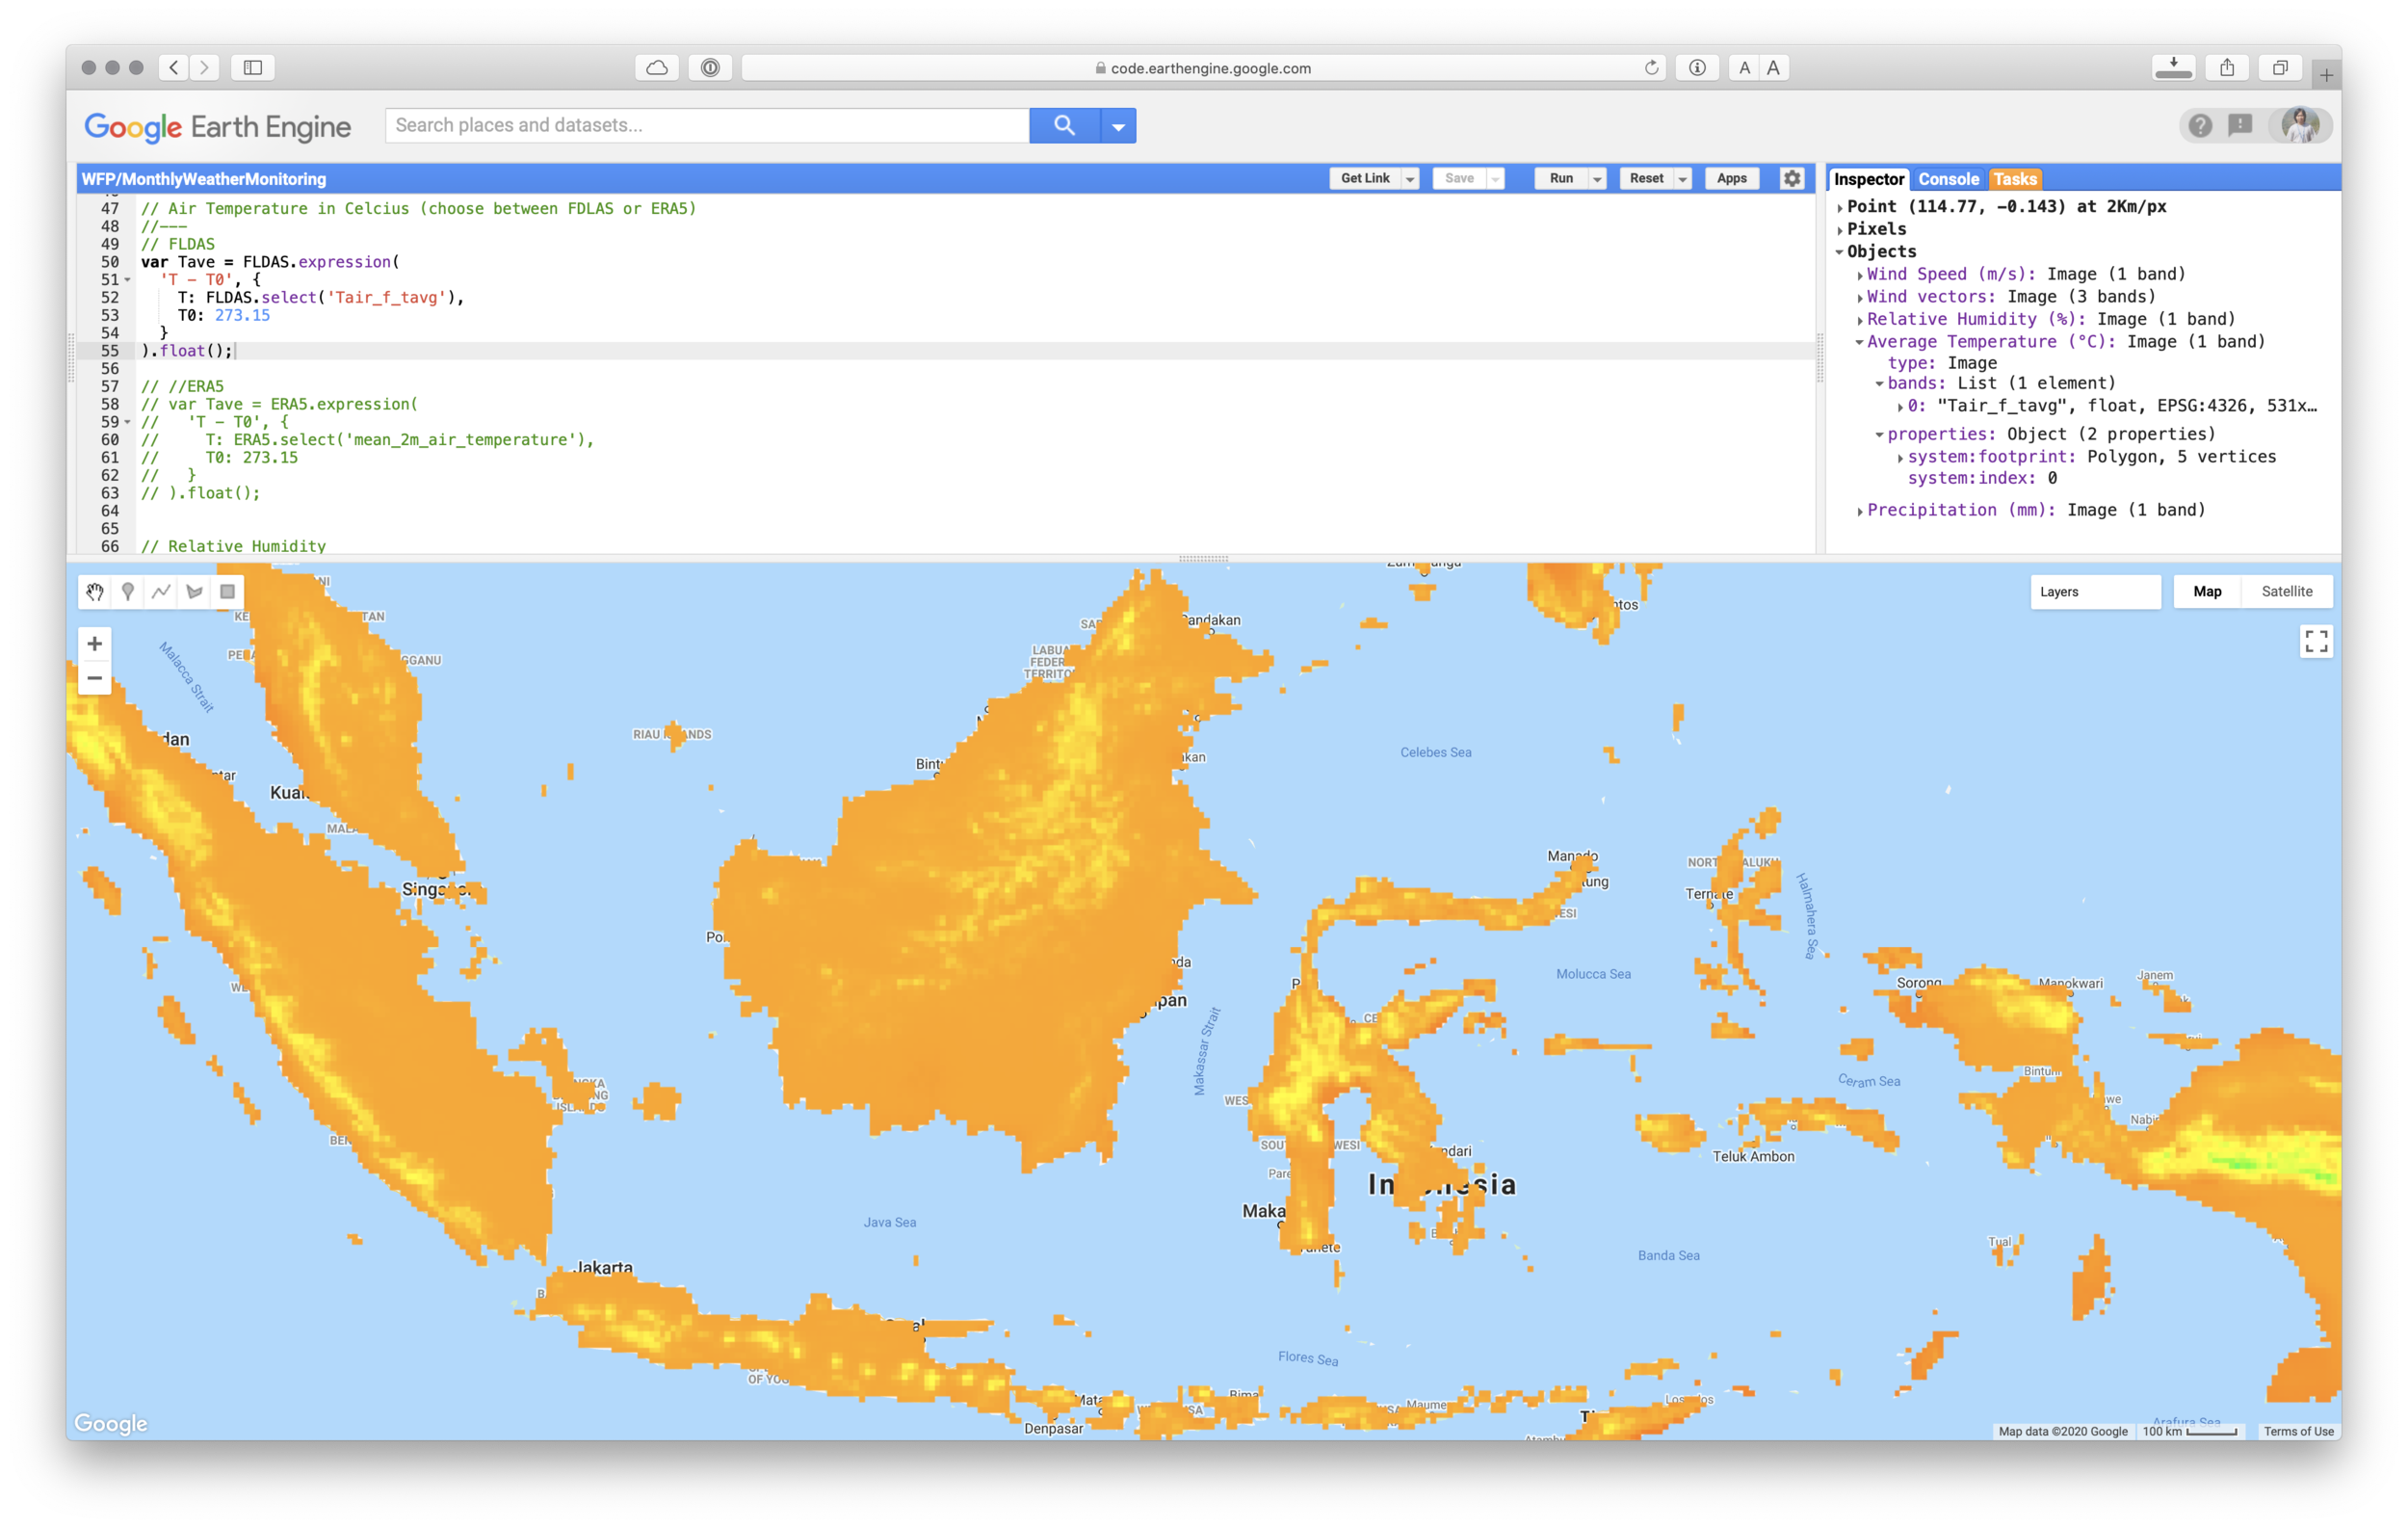
Temperature data
- Kelvin to Celsius temperature conversion can be done by subtracting 273.15 from the Kelvin temperature in order to obtain the required celsius temperature. The Kelvin scale and the celsius scale are two different temperature scales which are related by the following formula: K = C + 273.15 (or) C = K - 273.15.
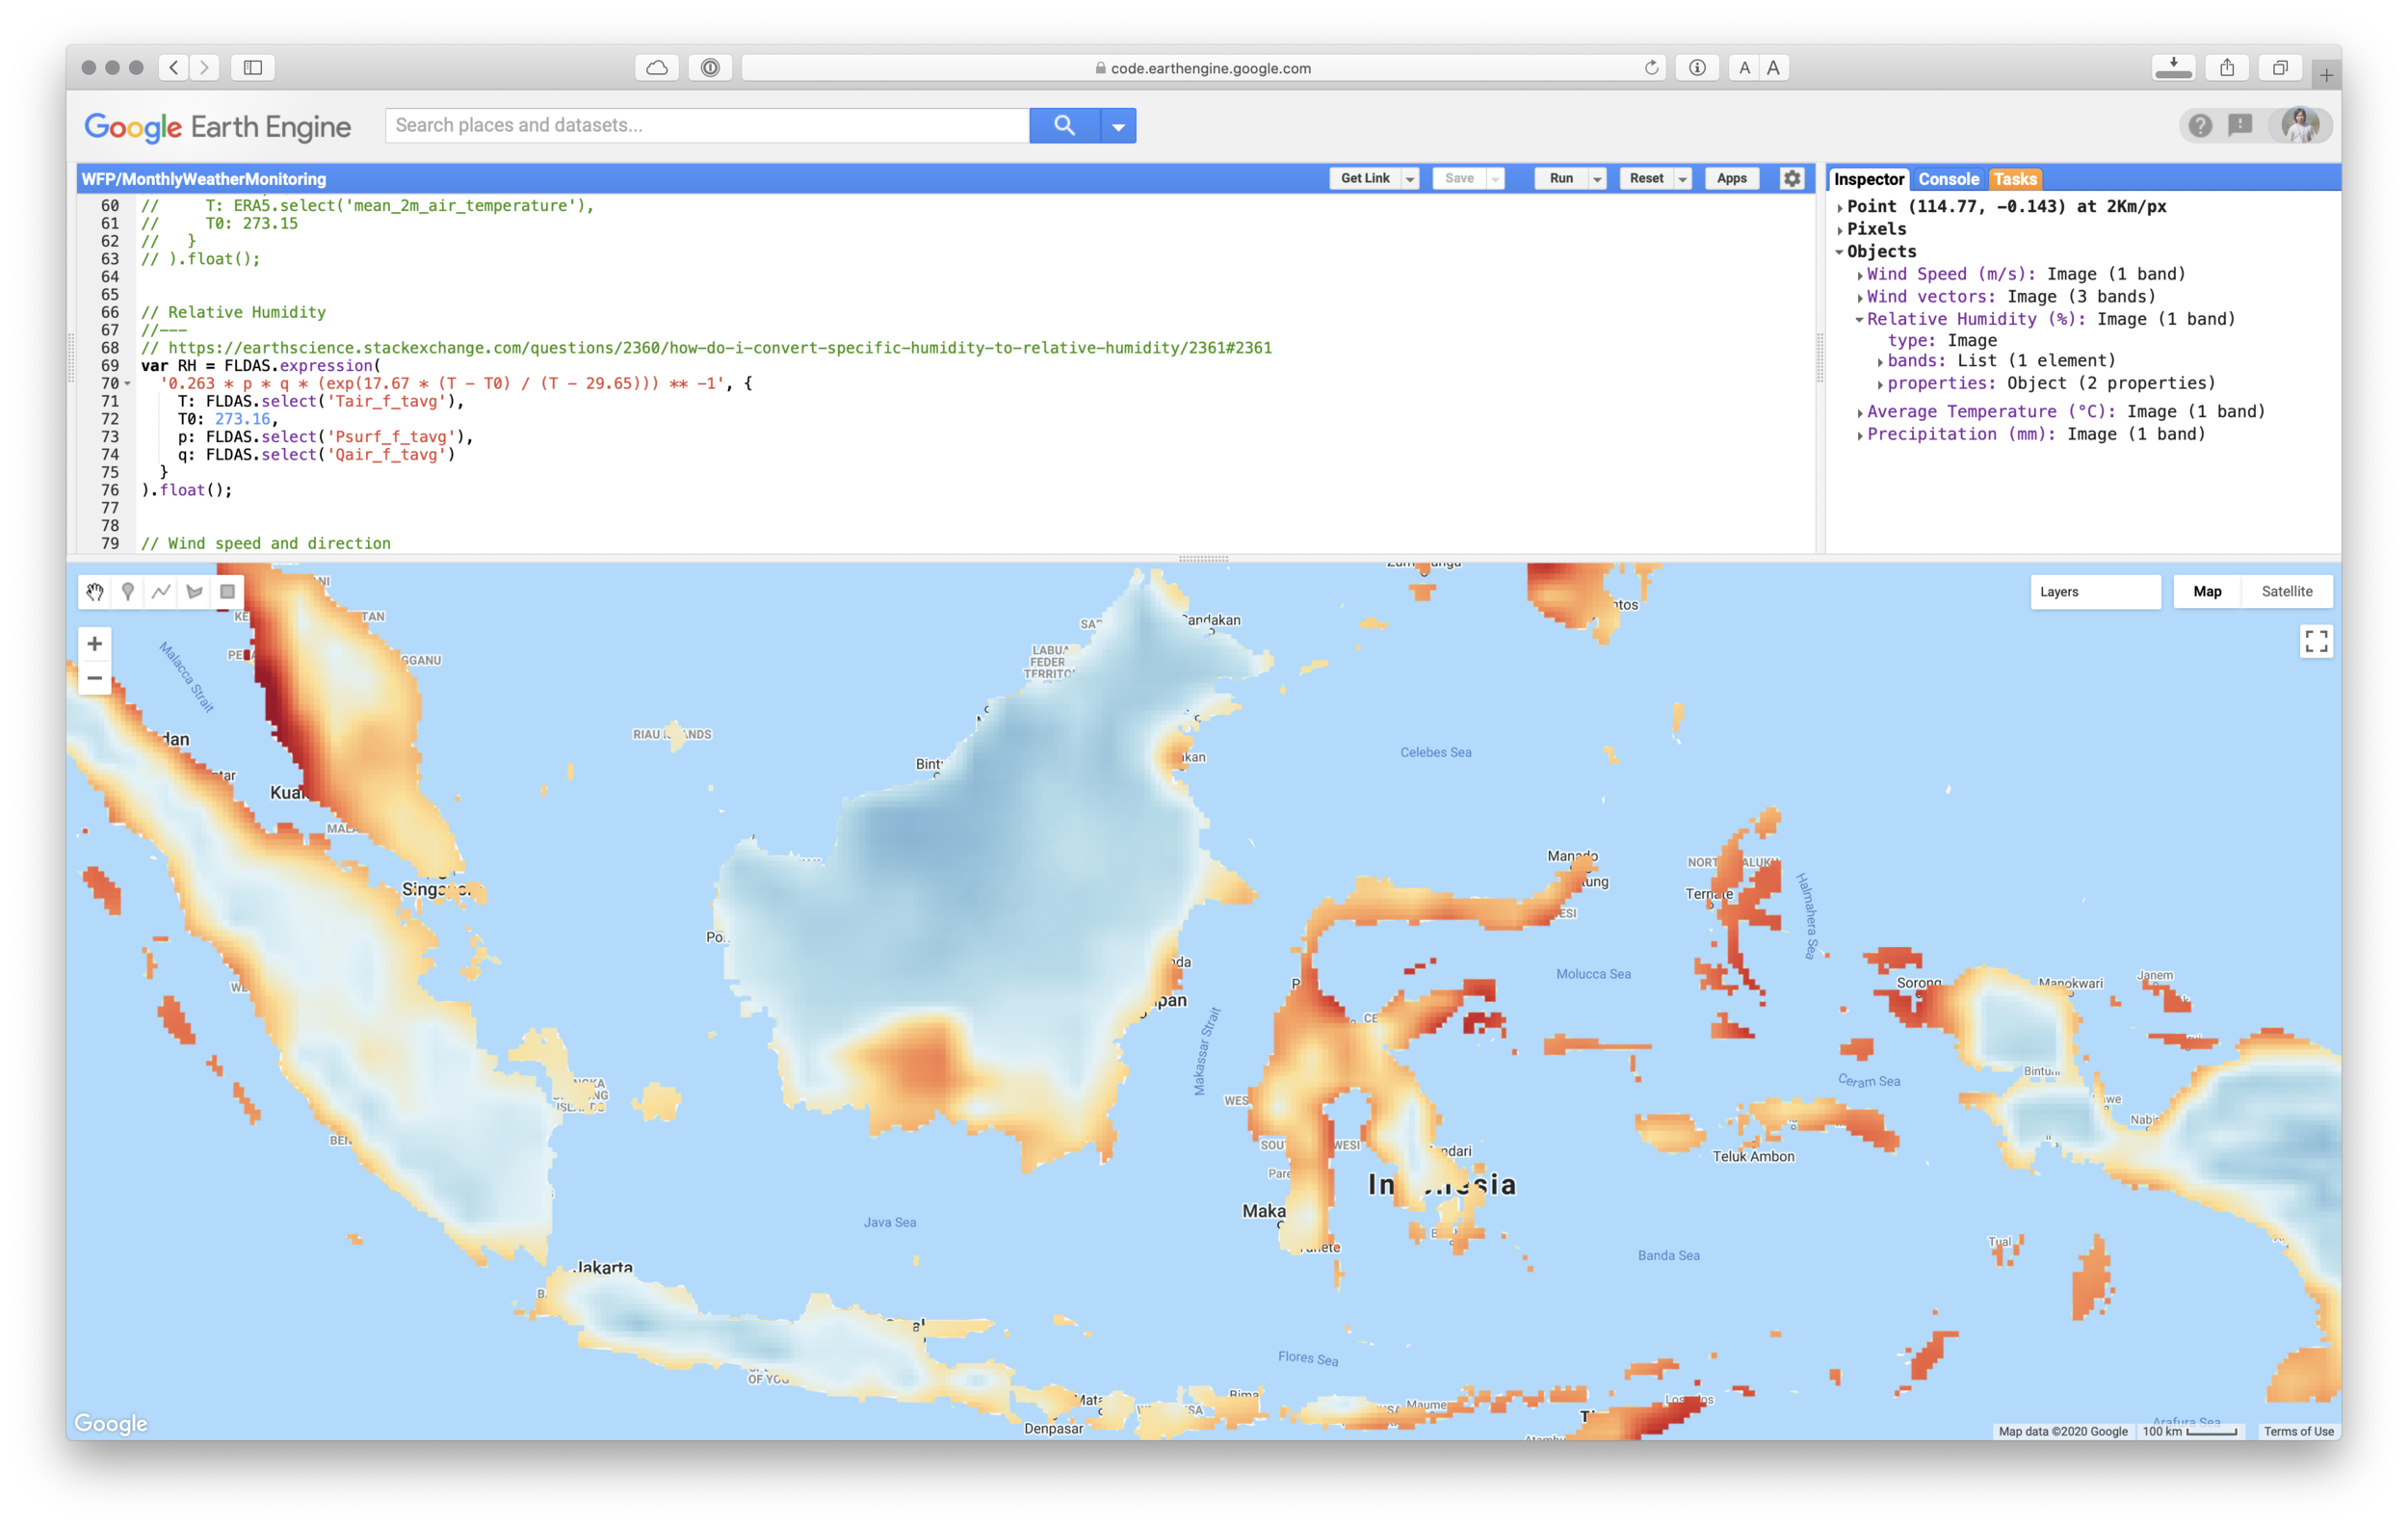
Relative Humidity
FLDAS only provide Specific Humidity data, so we need to convert it into Relative Humidity. From equation in this page: https://earthscience.stackexchange.com/a/2361 we can easily calculate RH as follow:
RH = 100 * (w/ws) ≈ 0.263 * p * q * [exp(17.67(T−T0)T−29.65)]^-1
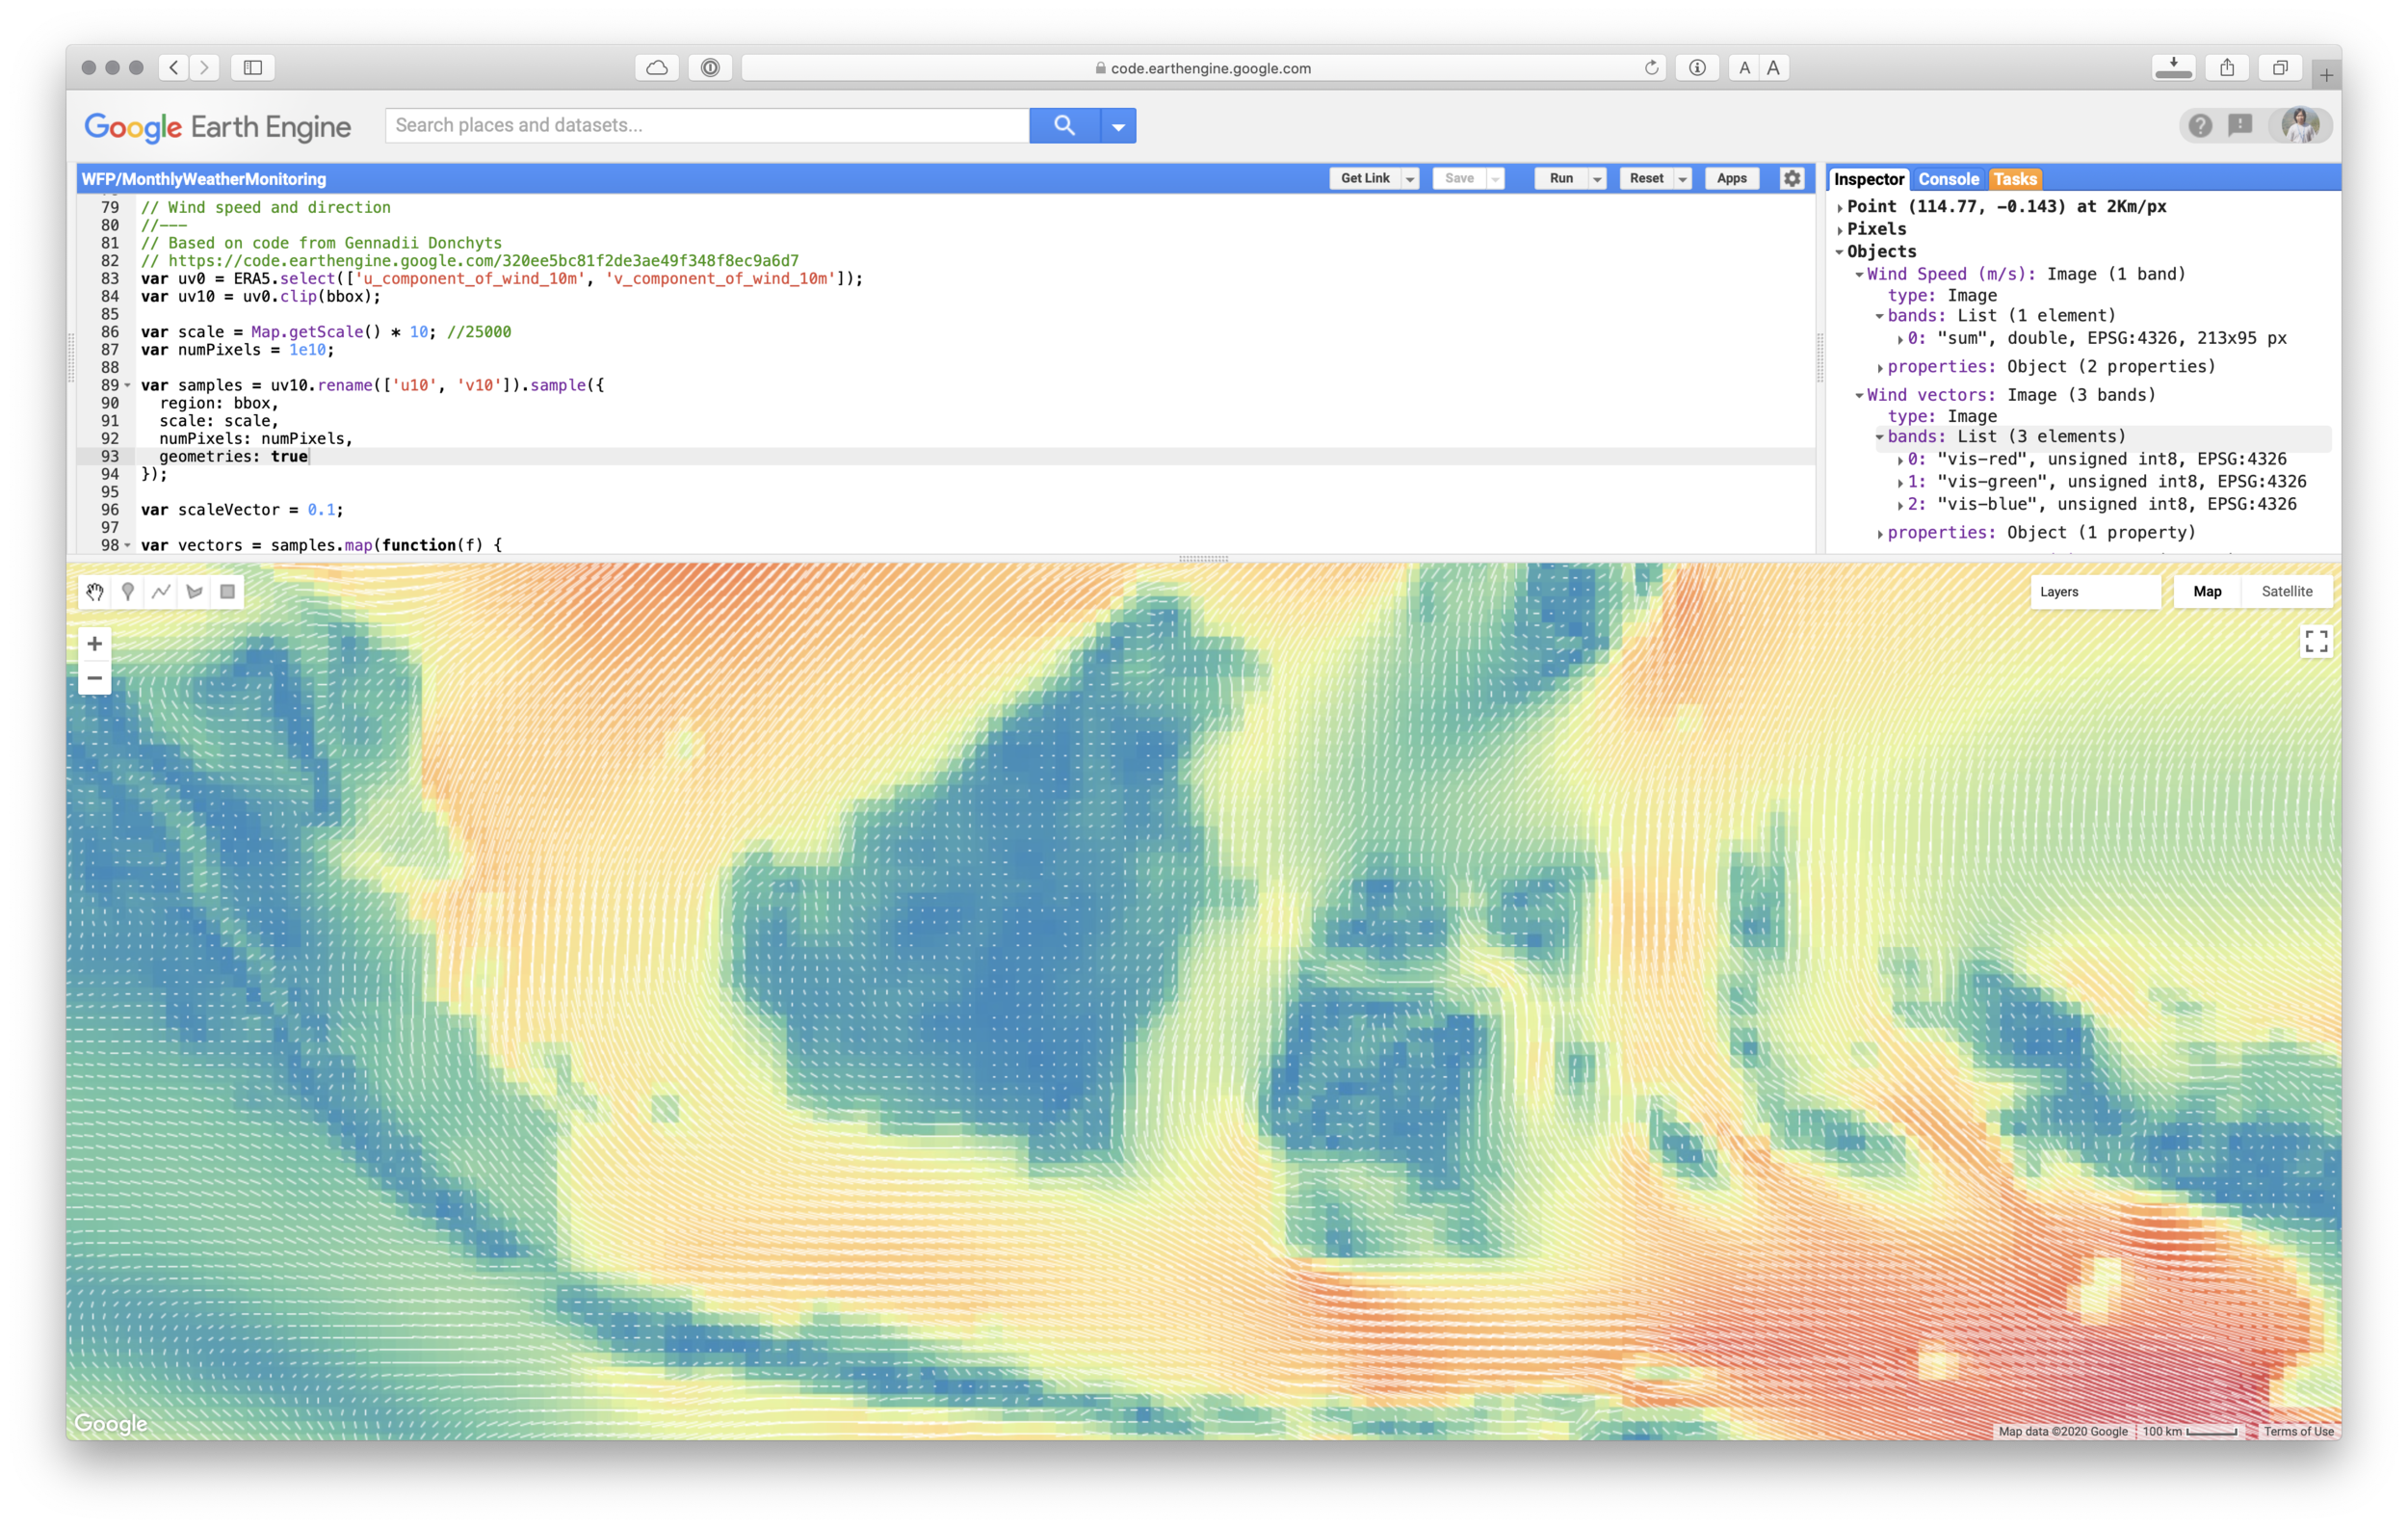
Wind Speed and Direction
From Google Earth Engine Developer Groups, Gennadii Donchyts share his code on how to visualise wind vector. Lets adapt the code to use with ERA5 data.
Finally, if you want to download the data, you can add below code:
Link for the full code
Notes: The code was compiled from various source (GEE help, GEE Groups, StackExchange)