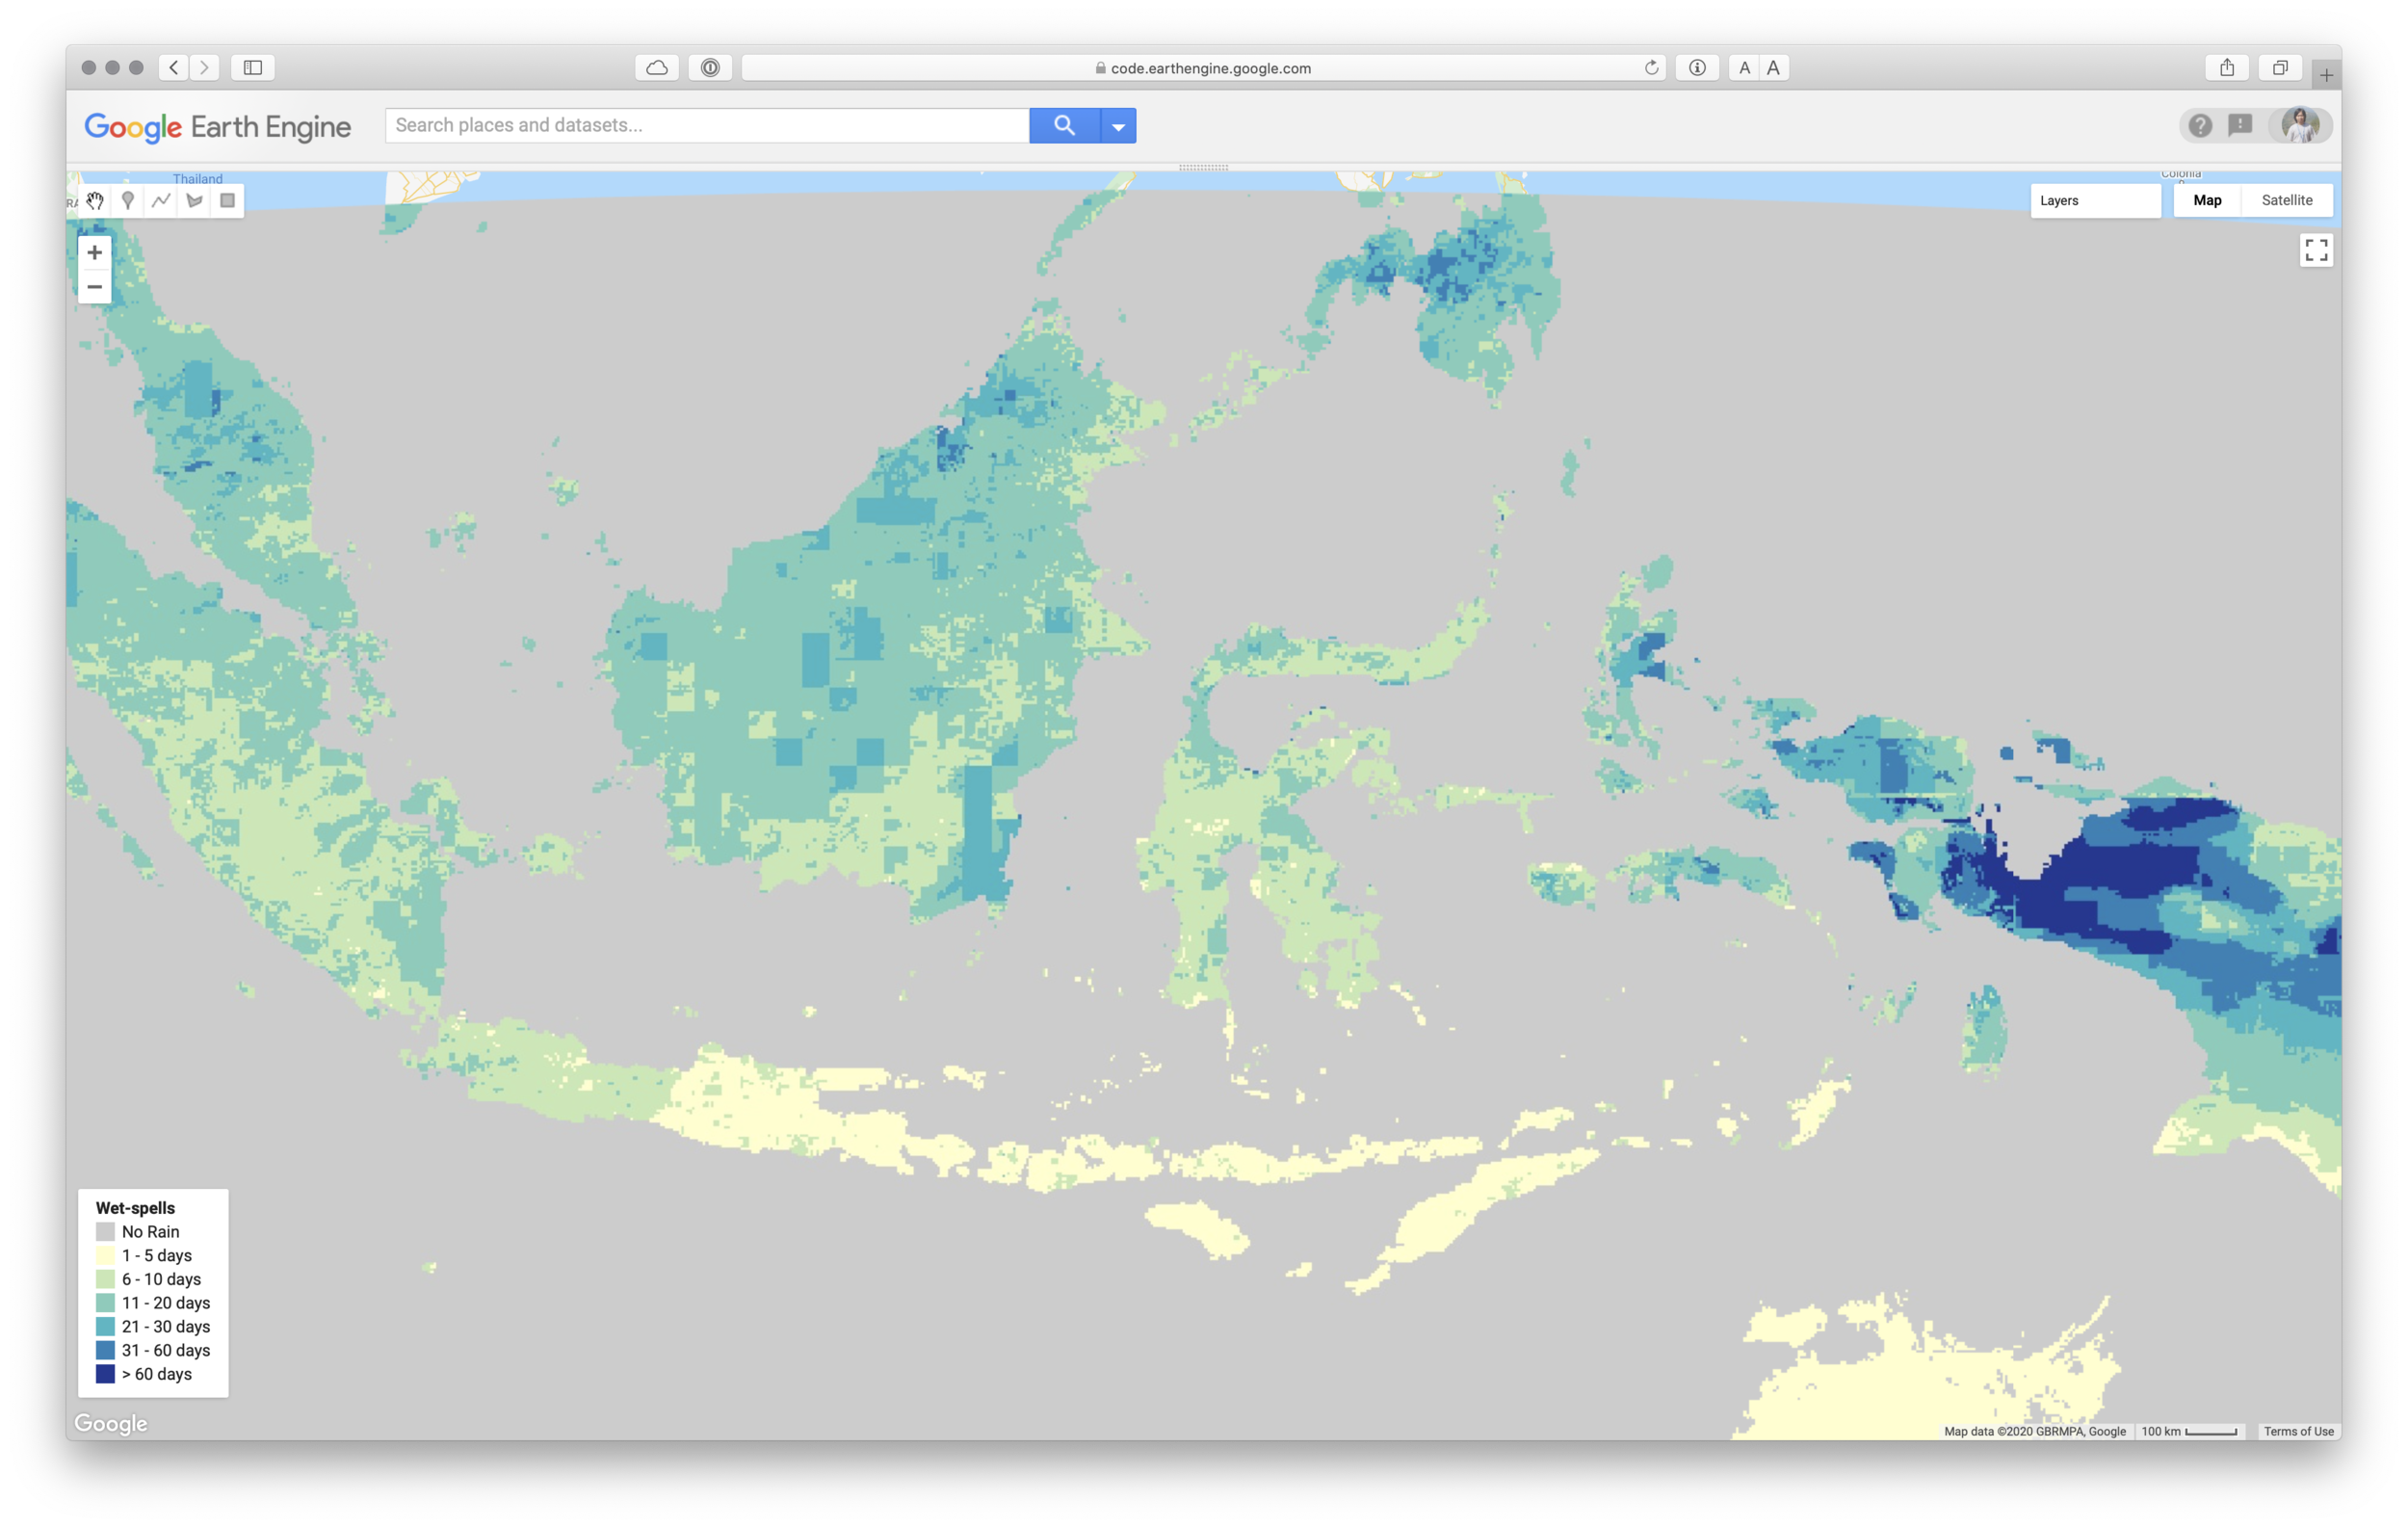
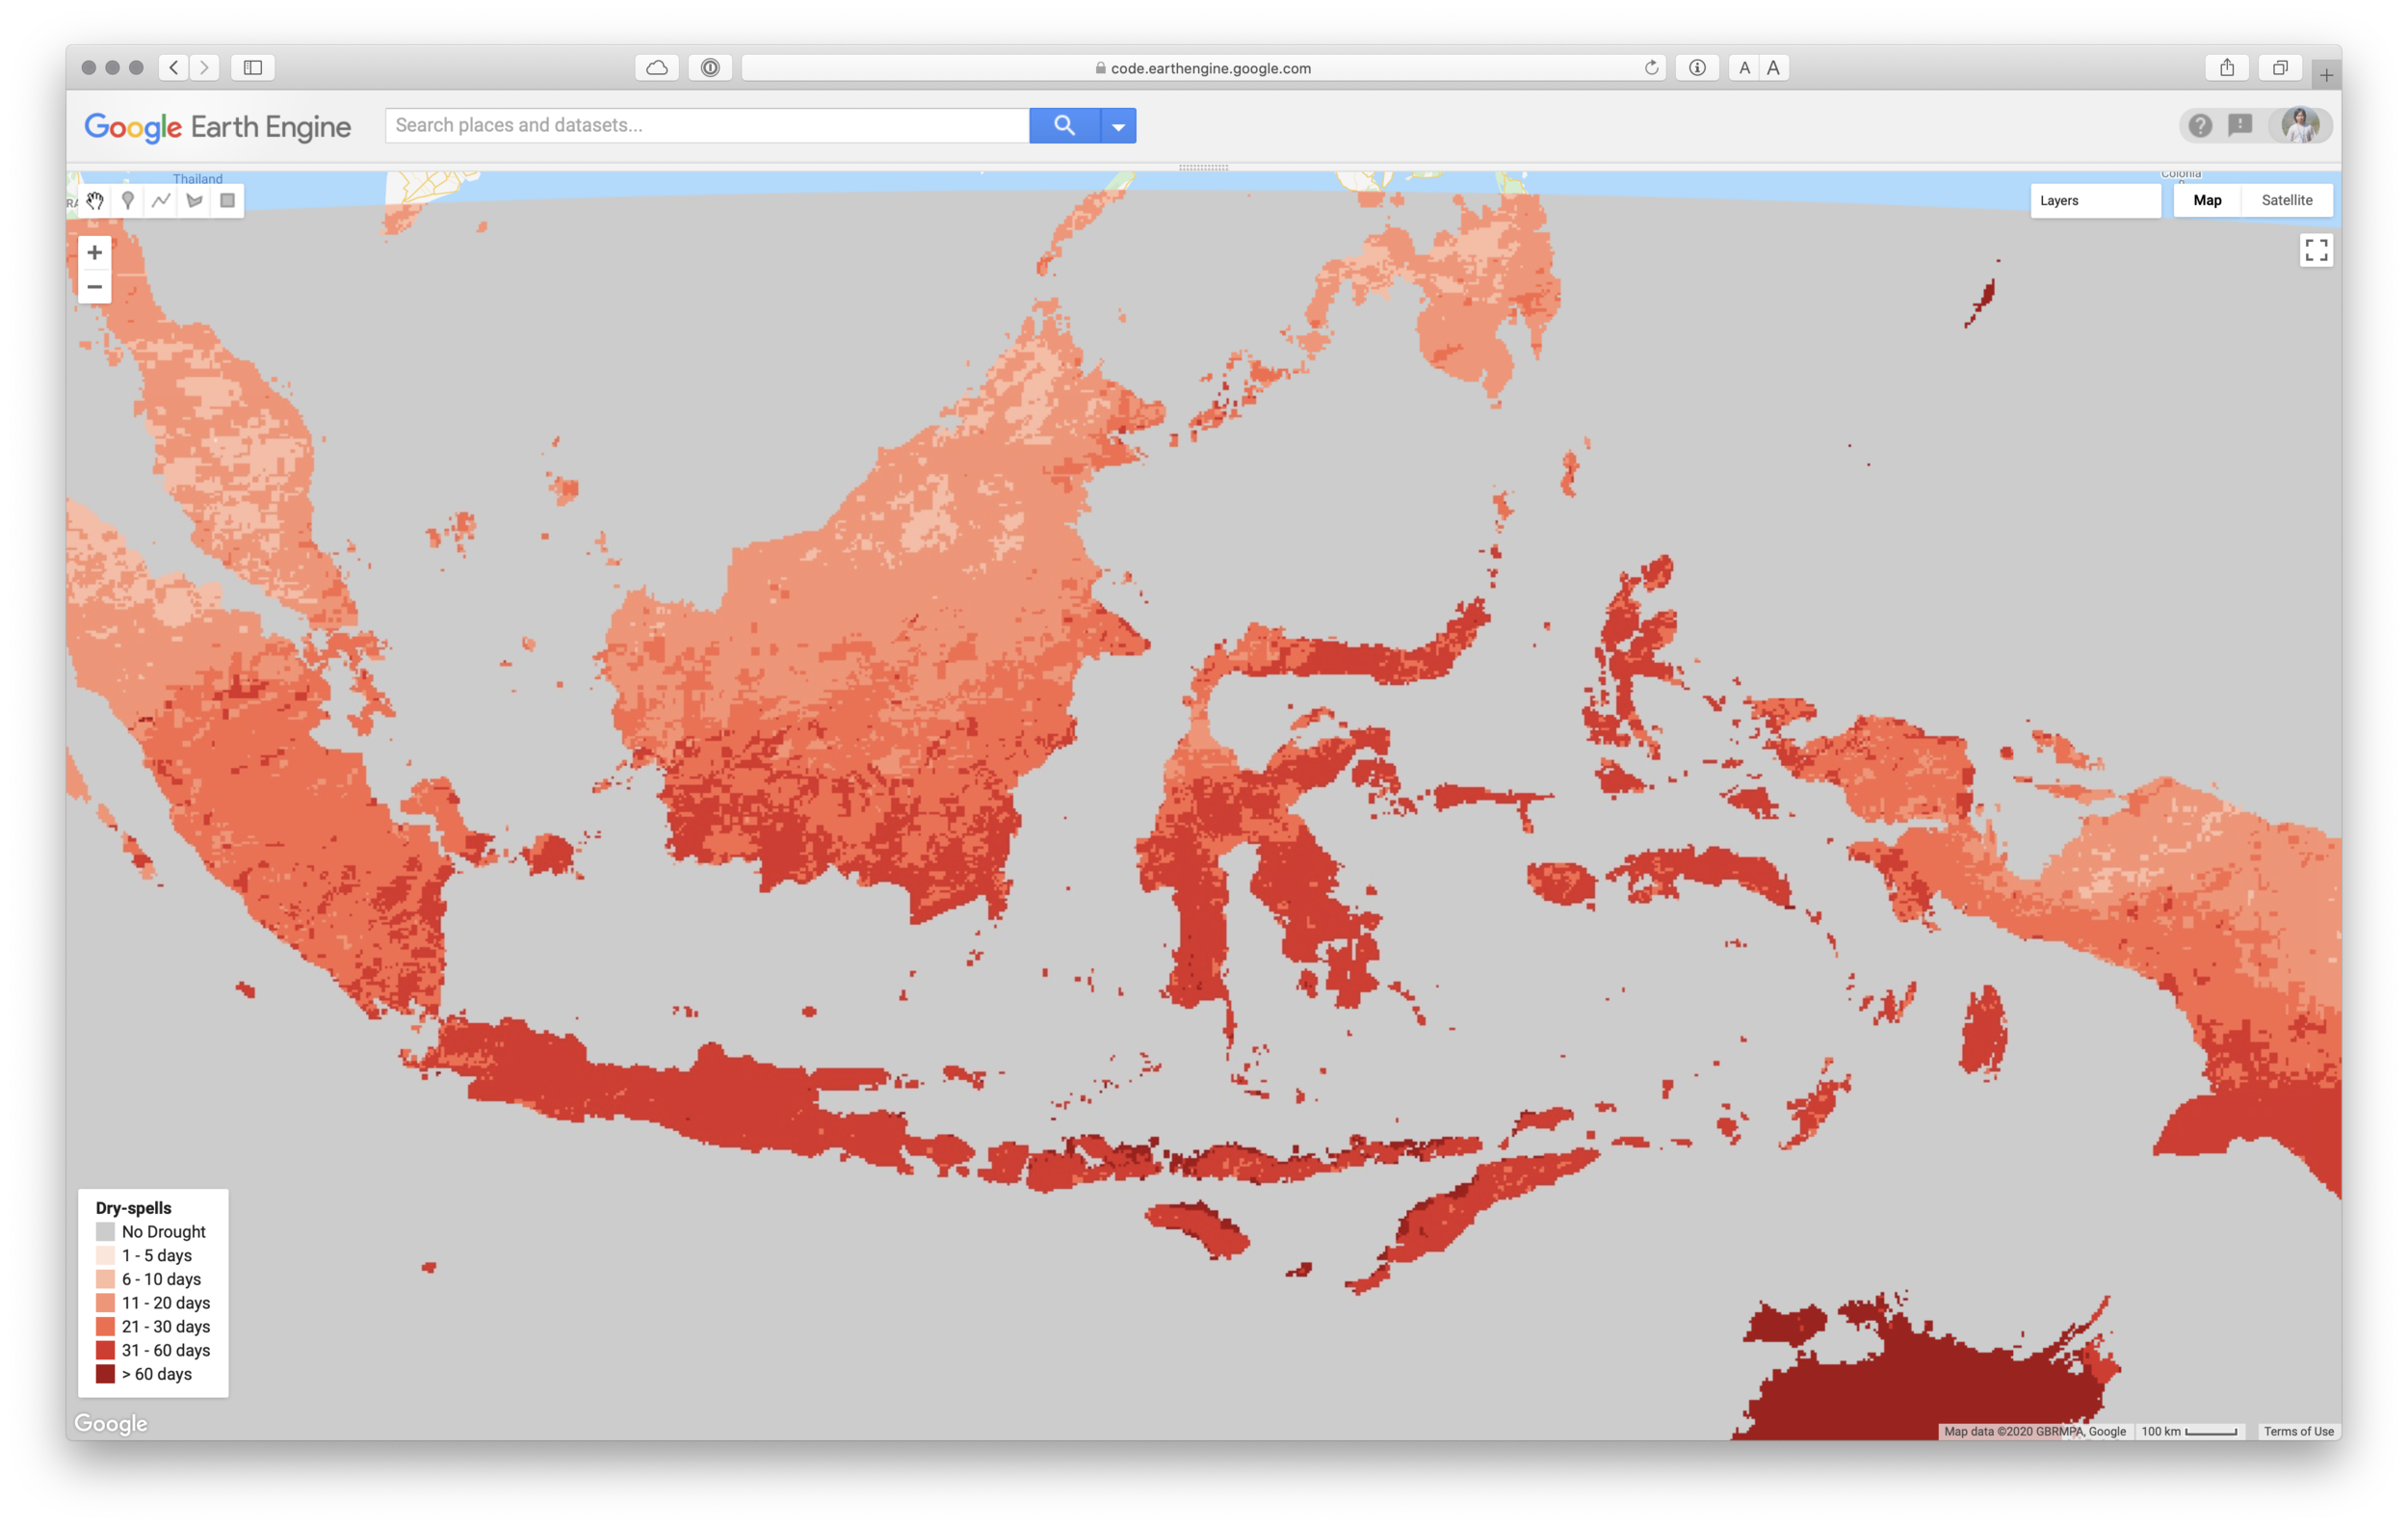
Number of dry and wet-spell
Remote Sensing
Research
Climate
Now, it’s easy to get statistics information on AVERAGE, MINIMUM and MAXIMUM number of consecutive dry and wet days for a certain period using Google Earth Engine platform
Now, it’s easy to get statistics information on AVERAGE, MINIMUM and MAXIMUM number of consecutive dry and wet days for a certain period using Google Earth Engine platform. Copy below code and paste into GEE.
You can modify:
- Bounding box or area of interest
- Start and End of YEAR, MONTH and DATE
- Precipitation threshold which can be considered as rain day.
- Symbology as SLD style
- Palette
Example of the analysis
Link for the full code
Notes: The code was compiled from various source (GEE help, GEE Groups, StackExchange)