GeoTIFF to NetCDF file with time dimension enabled and CF-Compliant
UPDATE: as of 4 January 2024
- [15 July 2023] I made a revision to below script, to prevent the result shifted half pixel. Please use the notebook from here: https://gist.github.com/bennyistanto/a8aec5ce3130b13c48609a43daa8bc57
- [4 January 2024] I also make other version that could handle daily or time series data from multi year period, grouped by year, process each year. For this purpose, please use this notebook: https://gist.github.com/bennyistanto/0df25c2f8b453dc1f824e7628d51e605
Few months ago, I wrote a step-by-step guideline on how to calculate SPI using CHIRPS data. New problem arises when I try to re-run SPI calculation using latest data, I didn’t imagine before that this process was so complicated. Several questions and idea came up in my mind:
- The latest rainfall data is available for this month (3 files in total), in separate GeoTIFF file. They provide netCDF format only for the whole period and yearly data.
- Should I re-run for the whole periods, 1981 to date? That’s not practical as it required lot of storage and time processing if you do for bigger coverage (country or regional analysis).
- I have try to manually convert GeoTIFF file to netCDF using GDAL: gdal_translate -of netCDF input.tif output.nc, it’s worked. But the time dimension is not enabled. While SPI script will read the netCDF input file based on time dimension. It means SPI script will not work with this solution.
- Using NCO, I can easily rename any variable with ncrename and add attributes to the content with ncatted. But I think this is too much work if every time I update the data, then I need to update the attribute.
- After discussed this problem with friends, finally I found the solution. I used Rich Signell’s script on StackExchange: https://gis.stackexchange.com/a/70487 and adjust few code so can works using CHIRPS dekad data
This script will open possibility to create netCDF data using various data, i.e. MODIS Land Surface Temperature (MOD11C3), I can use this data to calculate Potential Evapotranspiration (PET) then the Standardized Precipitation Evapotranspiration Index (SPEI).
See below.
Adjustment is needed if using other CHIRPS timesteps (daily, monthly, etc.) data. And NCO must be installed before using this script.
Python script available in my Gist: https://gist.github.com/bennyistanto/1cf46ed00c2060a5c9d4182bb4da2e54
And below is the notebook version.
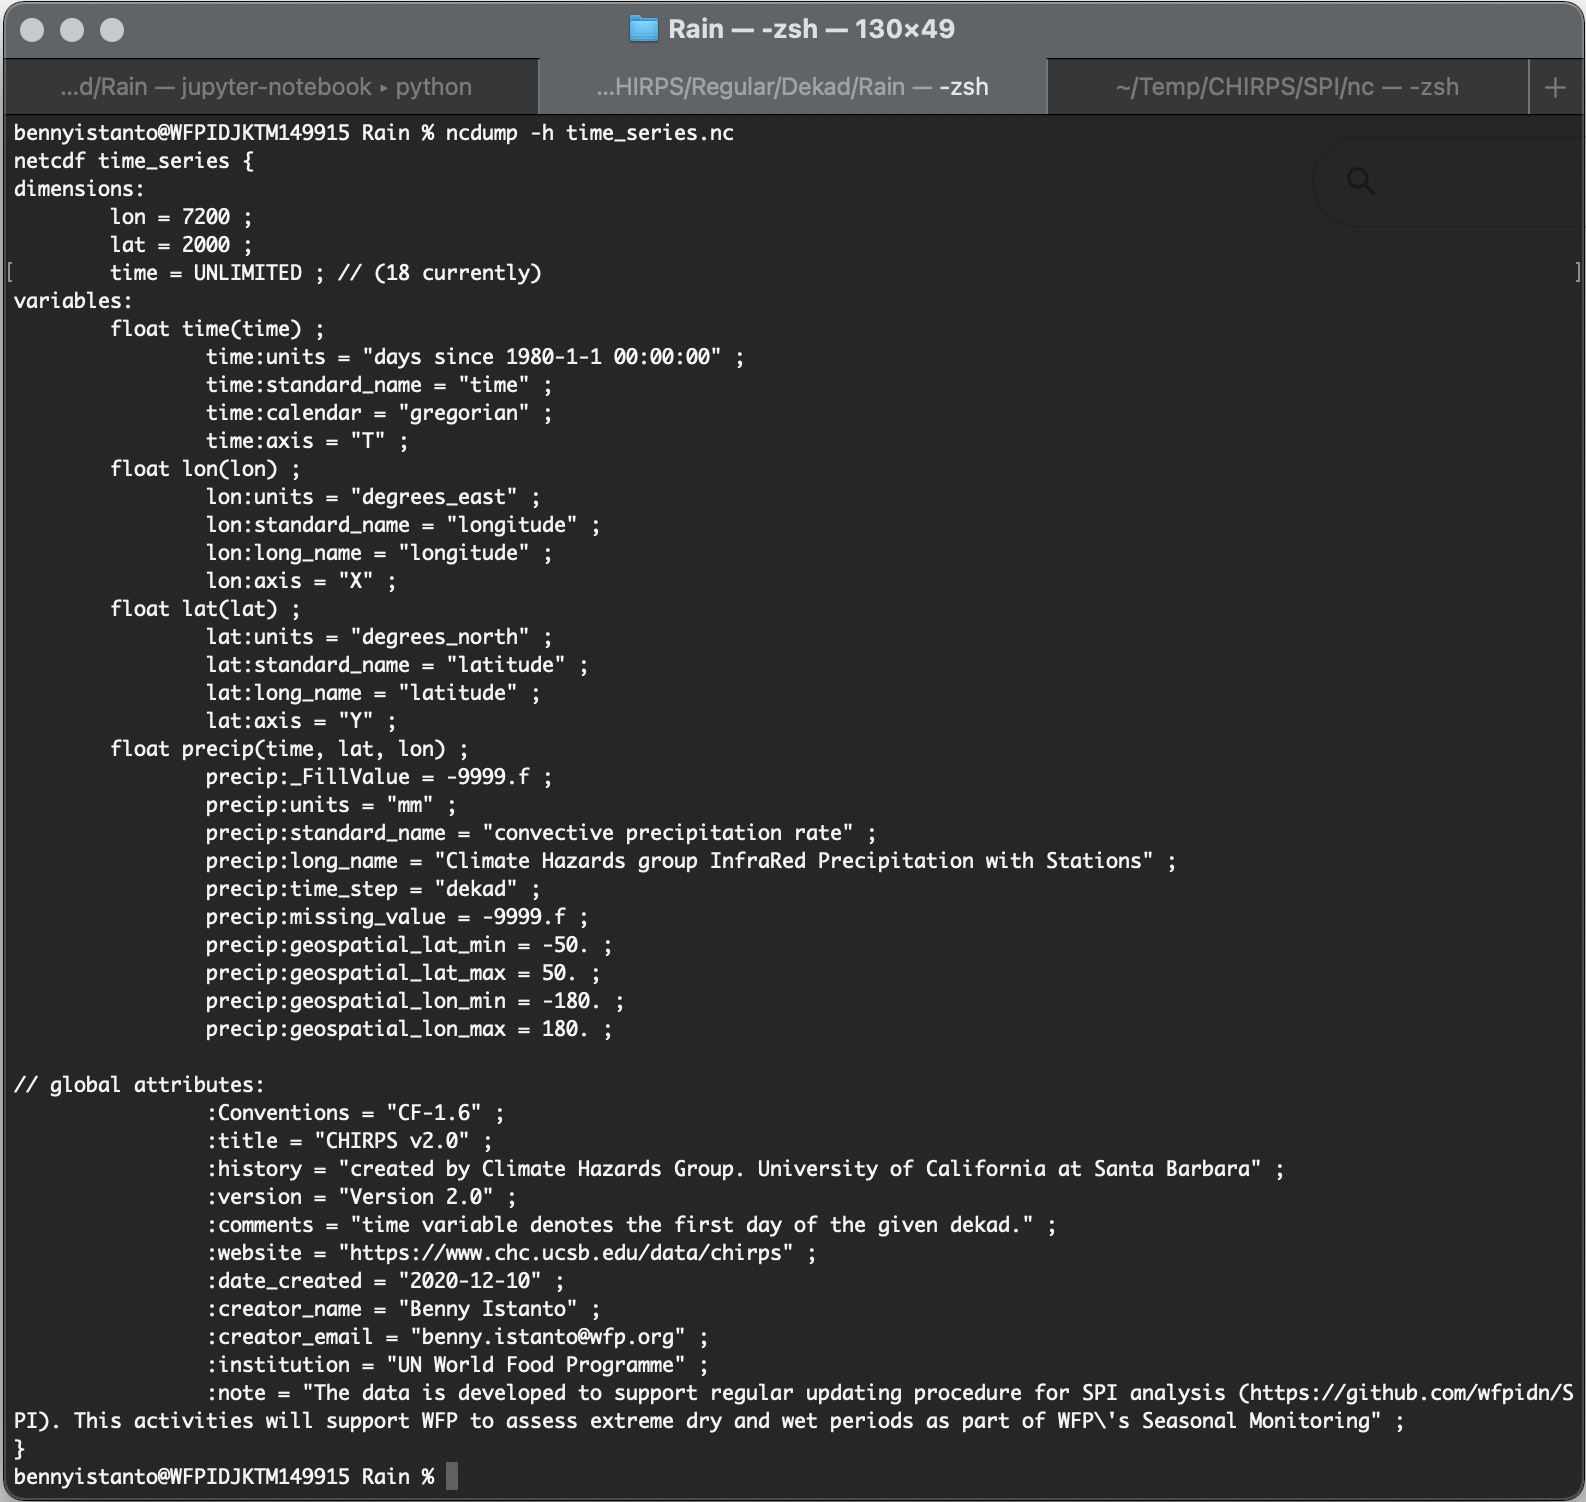
I tested using CHIRPS dekad data from Dekad 1, May 2020 to Dekad 3, Oct 2020. And below is the result checked using ncdump.
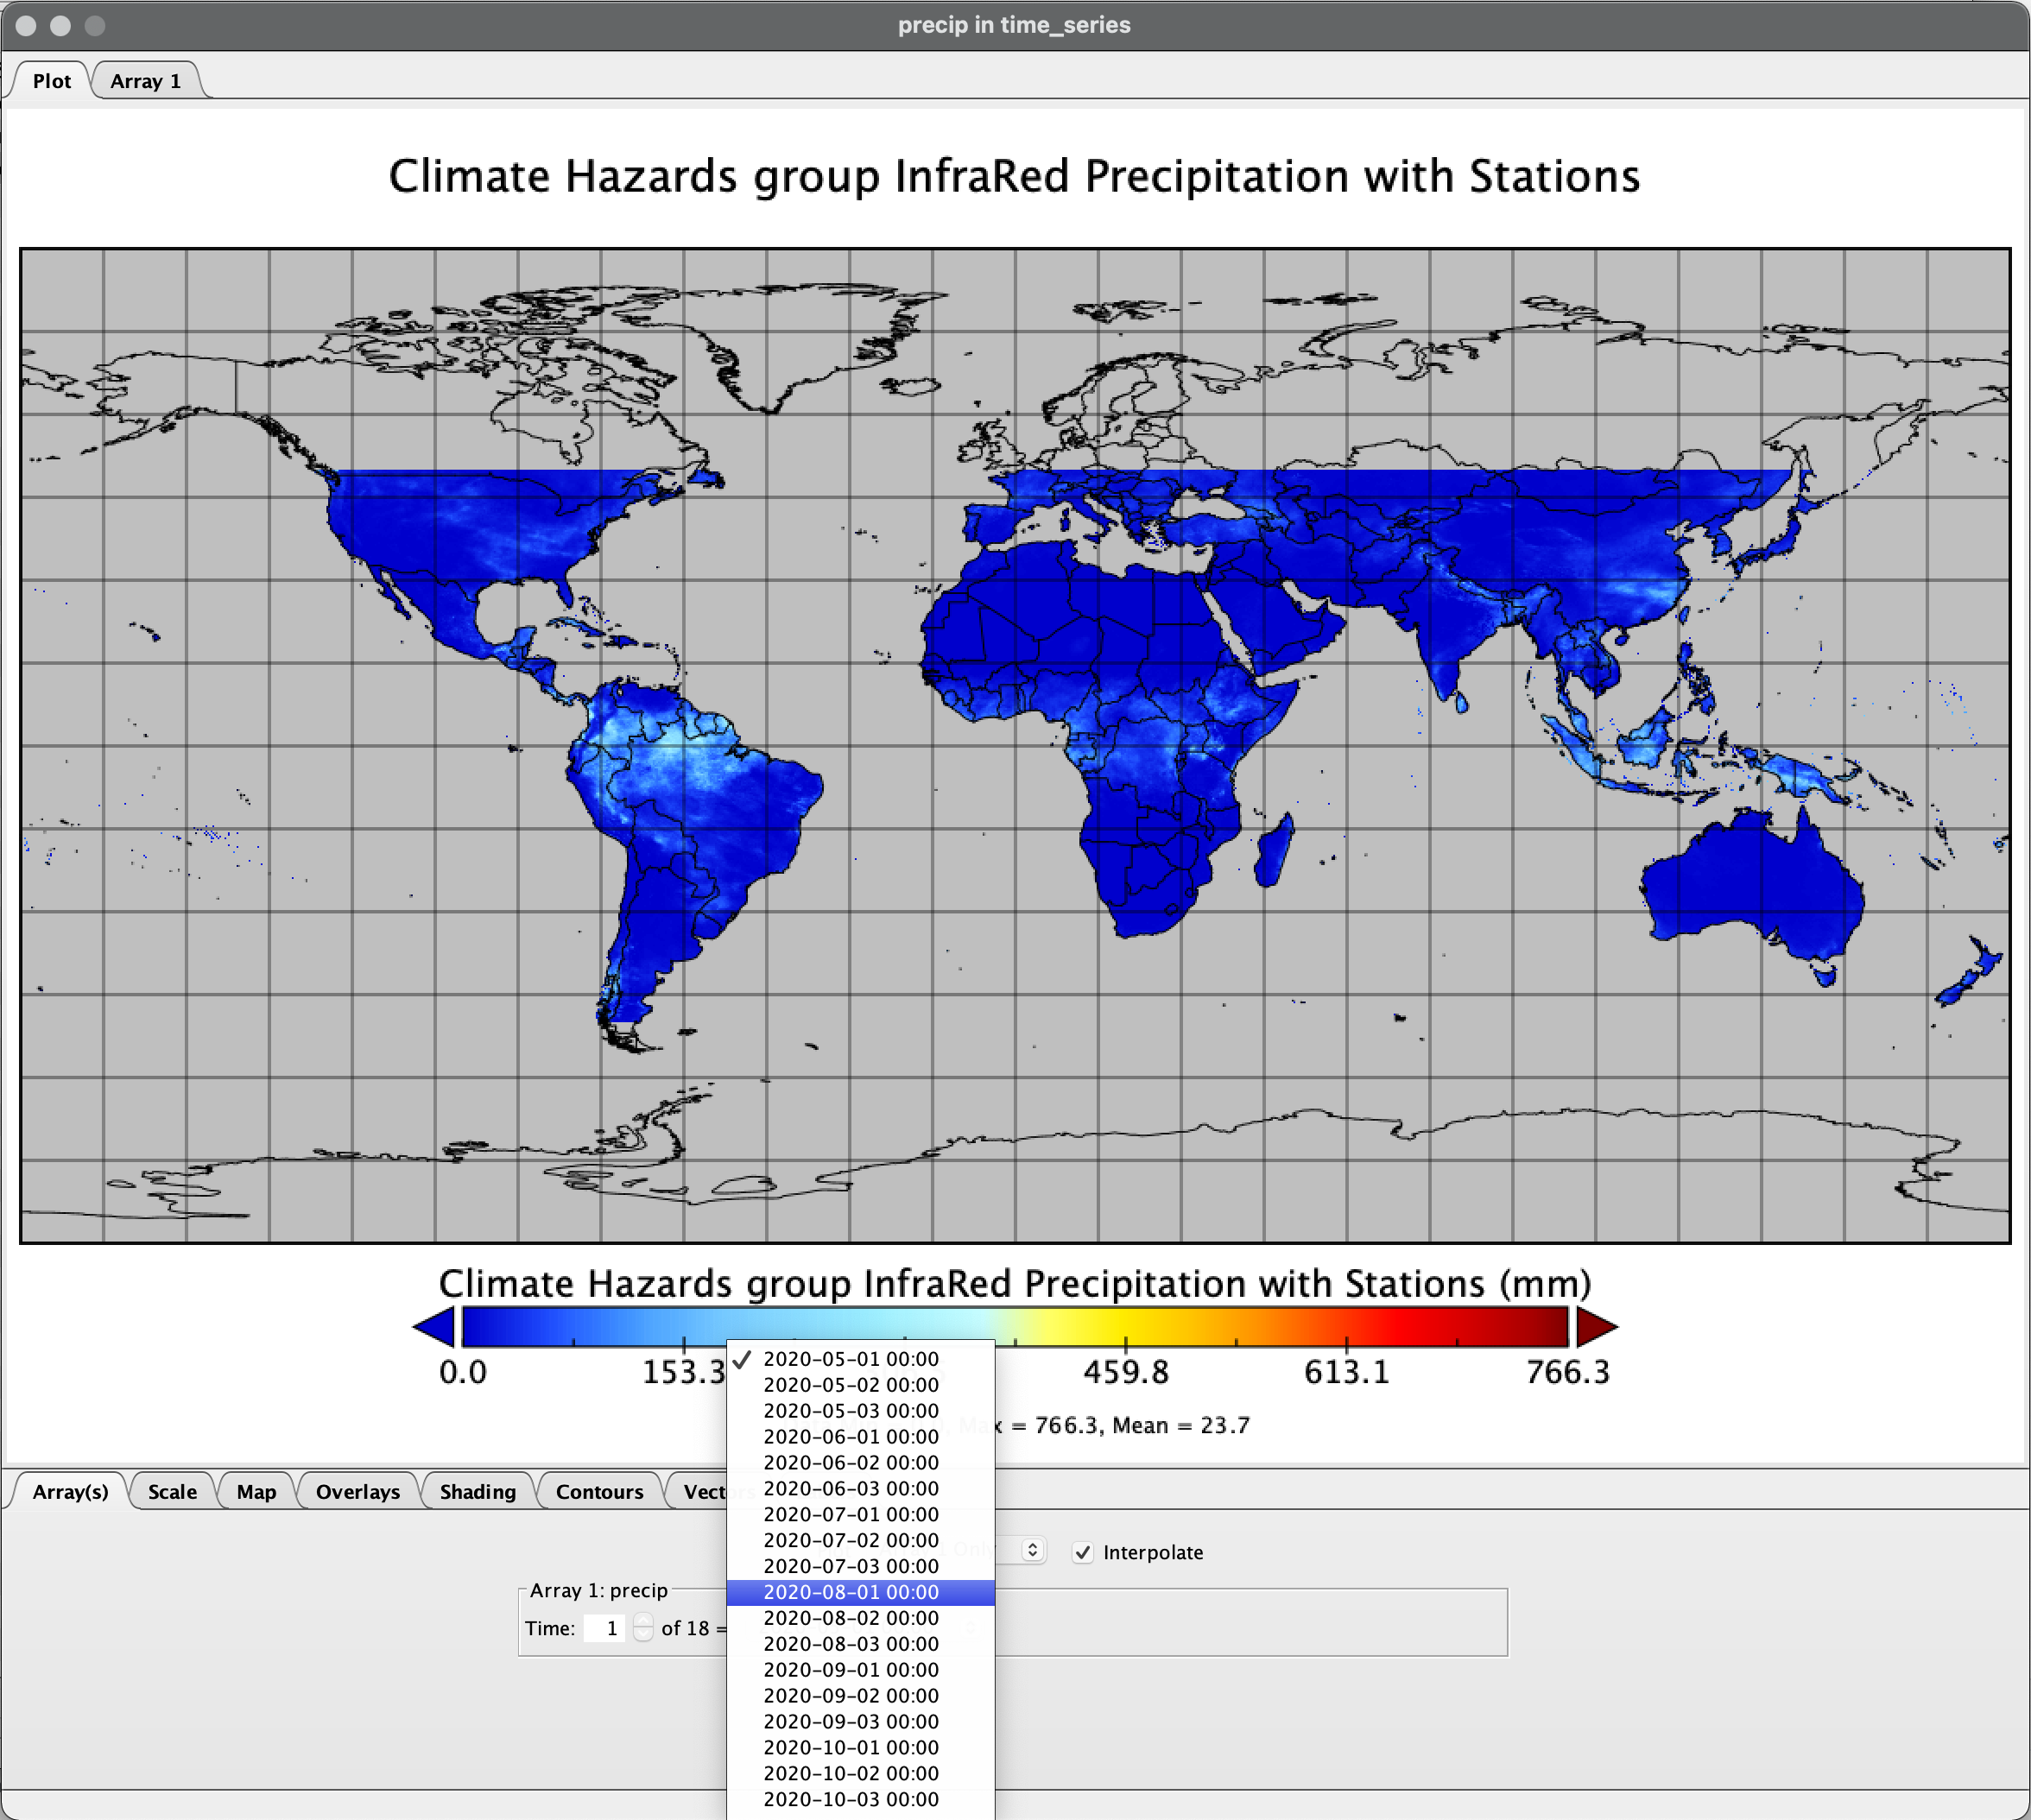
And visualize the result using Panoply