How to get daily rainfall forecast data from GFS? (Part 2)
Few days ago I wrote a post on how to get GFS data using GRIB filter and NCAR/UCAR Research Data Archive. Now I will explain on how to get GFS rainfall forecast data using Google Earth Engine (GEE).
GFS data description in GEE available in this link: https://developers.google.com/earth-engine/datasets/catalog/NOAA_GFS0P25
The Global Forecast System (GFS) is a weather forecast model produced by the National Centers for Environmental Prediction (NCEP). The GFS dataset consists of selected model outputs (described below) as gridded forecast variables. The 384-hour forecasts, with 3-hour forecast interval, are made at 6-hour temporal resolution (i.e. updated four times daily). Use the ‘creation_time’ and ‘forecast_time’ properties to select data of interest.
I found good explanation about GFS data in GEE in StackExchange, written by Kel Markert.
You have to be a little careful with GFS data because it can get pretty confusing with the timing (as you have already seen). First, the GFS forecast is initialized 4 times a day (at 00, 06, 12, 18 hours GMT) so you get 4 forecasts per day. Next, GFS forecast interval for an individual forecast is hourly for the first 5 days then goes to 3-hour intervals up to day 10 then goes to 12-hour interval for the rest up to 16 days as shown in the returned data from your example. So, theoretically you will get 60 (24+18+12+6) images per day with different forecast times if you keep track of all the timing.
However, Earth Engine does not keep track of all of the timing for you. If you look at the metadata, you will see that the system:time_start is equal to the creation_time (i.e. initialization time). So, when you use .filterDate() in EE (which uses the system:time_start property internally for filtering) you only filter by the day that the forecast was created (all the forecast initialization and forecast hours) and you get (5*24+5*8+6*2)*4 which equals the 688 images from your example.
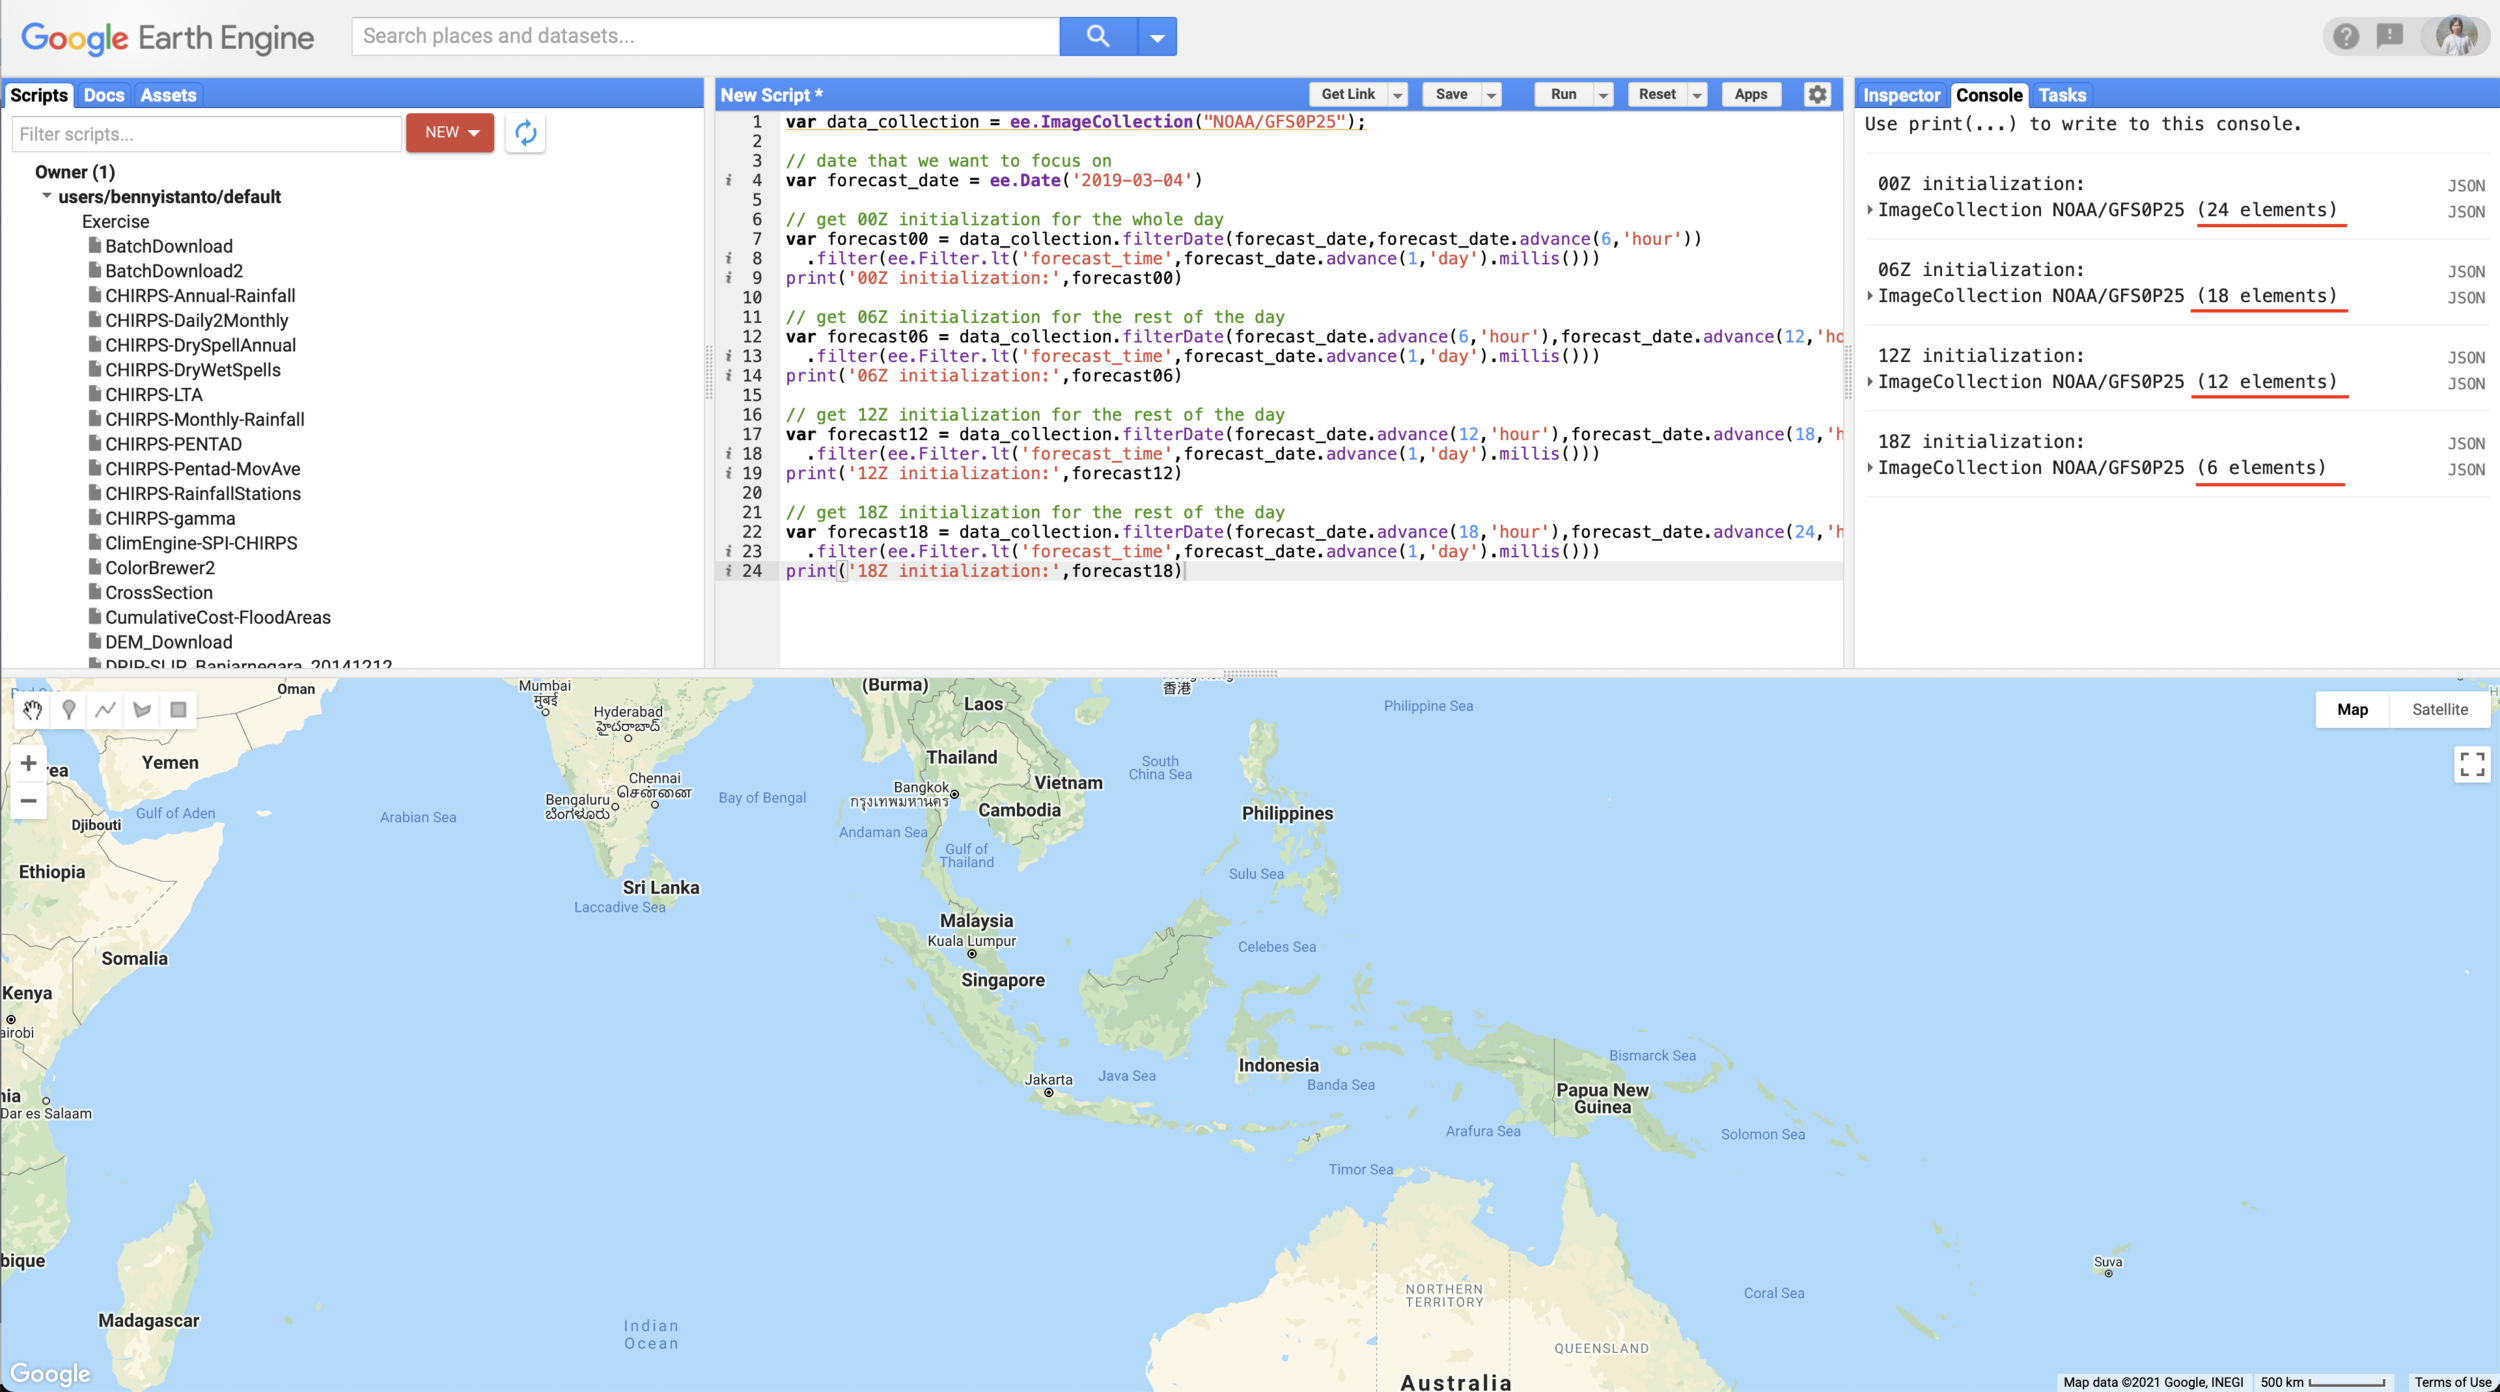
Hopefully that helps make a little more sense on how the data is structured in terms of time and now we can use that understanding to start filtering. Here is an example getting a single day from different forecasts initializations:
As you can see from the example, the .filterDate() is done on 6-hour intervals to get a specific forecast initialization, then the collection is filtered by the forecast time (within the date of interest).
Hourly and daily rainfall forecast from GFS
Before we start to use precipitation data from GFS, it’s better to understand the unit of precipitation. Let’s check in bands information below:
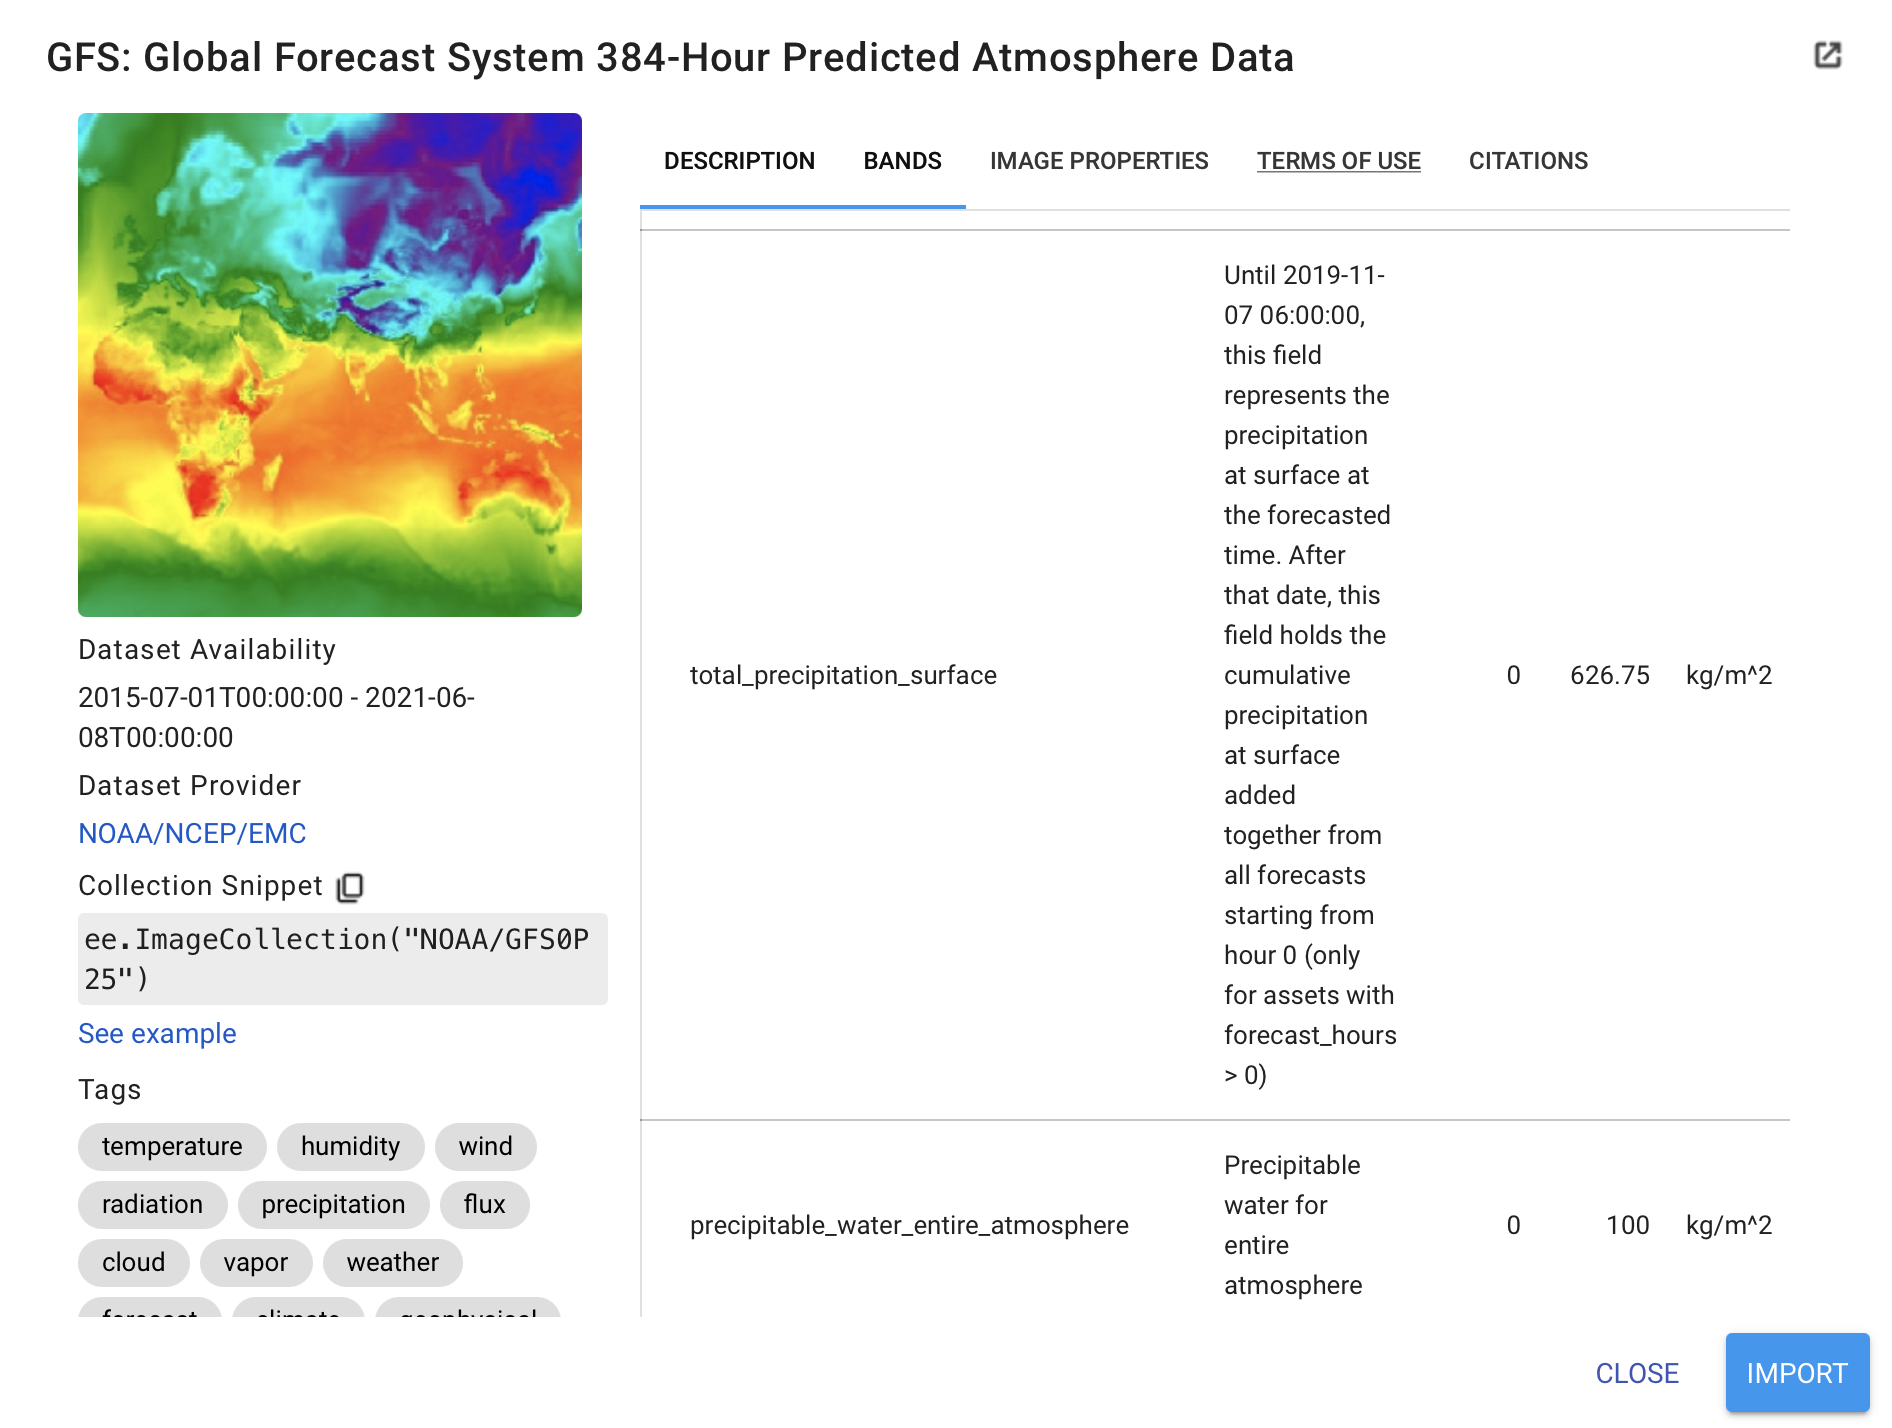
Precipitation unit in GFS data: “kg m-2 s-1”, is the International System of Units (SI) used for precipitation. While 1kg = 1Liter = 10e6 mm3 and 1m2 = 10e6 mm2. Therefore 1kg of rain over 1 m2 is equivalent to 1mm. As the unit is already in millimeters (mm), so this data is ready to use, no conversion needed.
Let’s start to write the code. As our area of interest is Indonesia, lets set the map center to Indonesia, symbology and set the date. In below example, I set the date to 4 April 2021, the day when Tropical Cyclone Seroja hit the eastern part of Nusa Tenggara, Indonesia
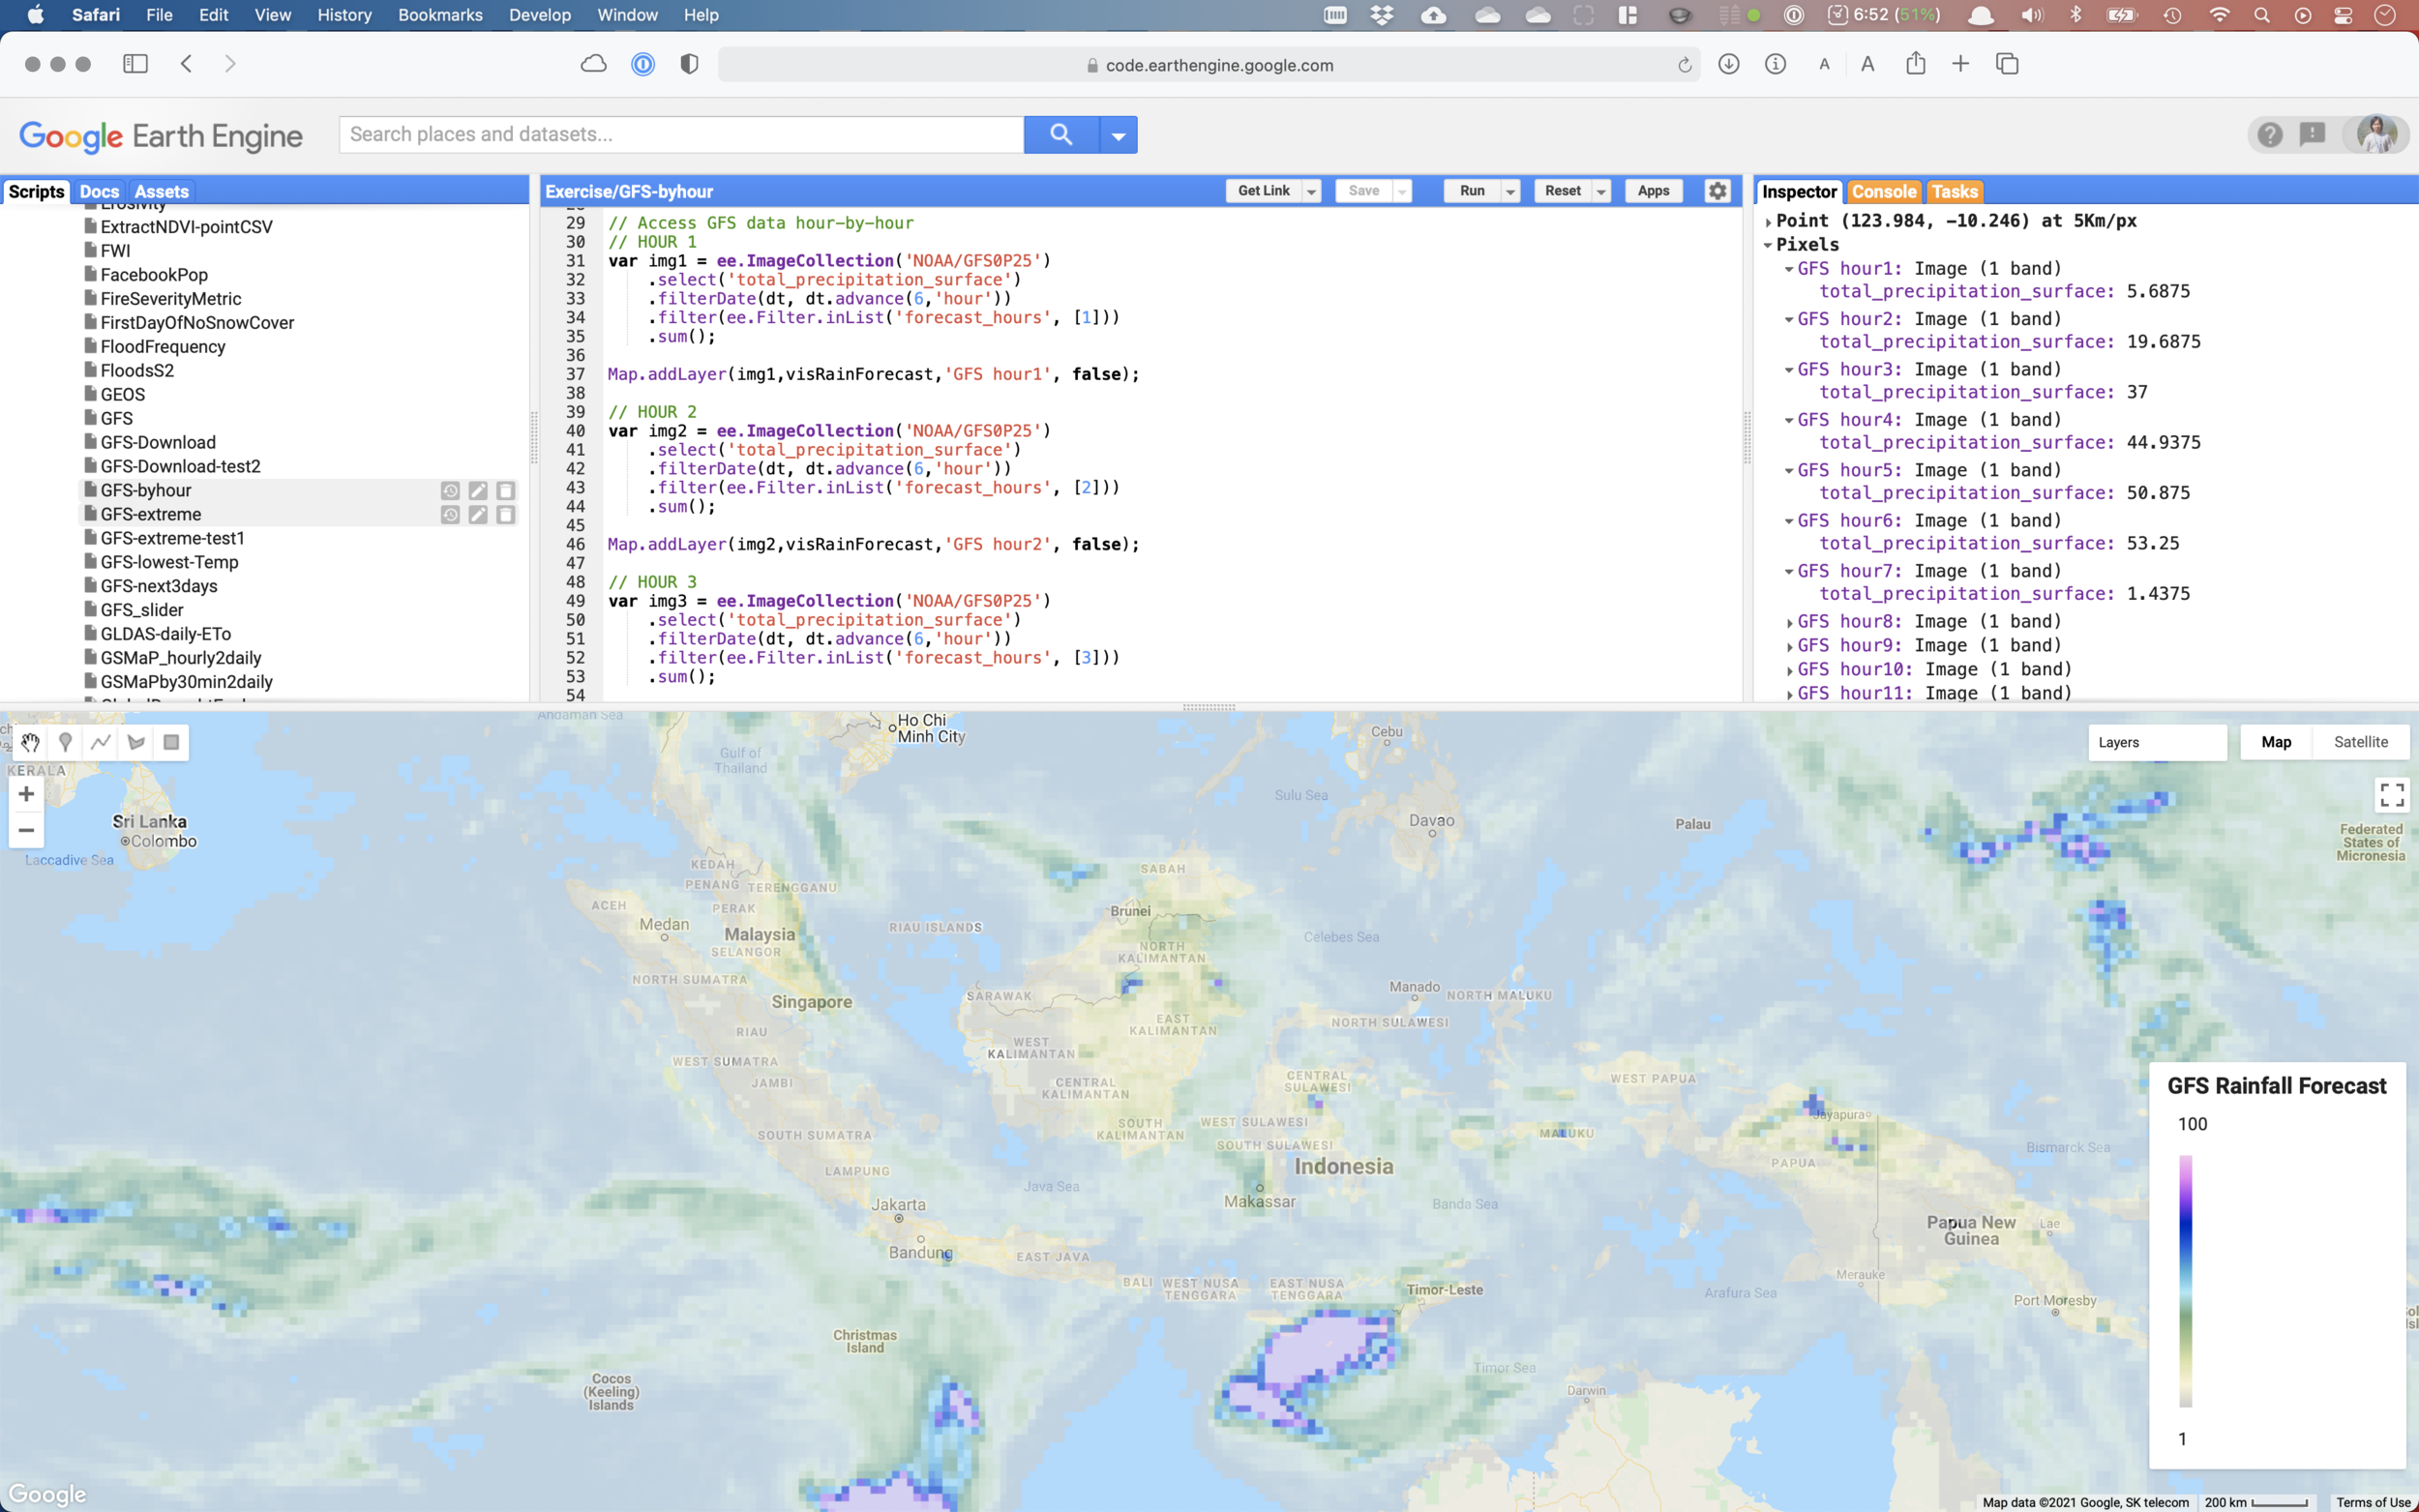
Now as the main input, Import GFS data from here https://developers.google.com/earth-engine/datasets/catalog/NOAA_GFS0P25 and select Bands for “total_precipitation_surface” and do filtering based on date and “forecast_hours”.
Below script is example to grab forecast for hour-1 after the release hour. See details below:
- Release date and time: 4 April 2021, 18:00 UTC ~ 5 April 2021 01:00 WIB
- Forecast hours = 1, it means rainfall forecast for 01:00 to 02:00 WIB
What if you want to have forecast for other hour periods (hour-2)? You can easily change value 1 in above script. See below.
Important notes related to GFS forecast data:
- forecast_hours equal to 1, means total in millimeters of rainfall accumulation forecast from beginning of forecast date as a start, until the next 1 hours.
- While the value is equal to 2, means total in millimeters until the next 2 hours, on and on up to 6 hours.
- Back to 1 starting from the 7th forecast_hours, on and on up to 12 hours.
- Continues repeatedly by 6 up to 120 hours (6,12,18,24,30,36,42,48,54,60,66,72,78,84,90,96,102,108,114,120).
- forecast_hours equal to 6, means total in millimeters of rainfall accumulation forecast from beginning of forecast date as a start, until the next 6 hours.
- While the value is equal to 12, means total in millimeters from hour-7 to 12.
- As stated early in above paragraph, GFS forecast interval for an individual forecast is hourly for the first 5 days (forecast_hours equal to 120) then goes to 3-hour intervals up to day 10 (forecast_hours equal to 240) then goes to 12-hour interval for the rest up to 16 days.
Now I will write process to calculate rainfall accumulation for 24-hours (1-day). The output will visualised using same standard symbology.
How about rainfall accumulation for 48-hours or 2-days. You can add below script.
Is there any alternative to calculate rainfall accumulation? You got it.
Example below, I try to calculate rainfall accumulation for 1-day which coming from hour-6, 12, 18 and 24. I need to extract individual hours before added into single image and do calculation via image expression.
Lets add the legend information into UI panel, to make user easy to understand how much rainfall will fall in certain areas.
Now this is the important task, downloading the data. Before write the download script, It’s better to clip it based on area of interest.
I don’t need global data, I am only interest to get data from 60E to 180E. Then I can continue to export it to Google Drive for each number of days of forecast.
Note: Please adjust folder name in your Google Drive.
Below is the result!
Link for the full code