Mean annual temperature and number of hot days in a year
This week I got request from my colleagues to calculate mean annual temperature and number of hot days in a year using MODIS Daily Land Surface Temperature (LST) data from 2000 until 2020 for Indonesia and Latin America Countries. The first thing that comes to mind is to use Google Earth Engine (GEE).
For this task, I will use MOD11A1.006 Terra Land Surface Temperature and Emissivity Daily Global 1km - https://developers.google.com/earth-engine/datasets/catalog/MODIS_006_MOD11A1. From the description: The MOD11A1 V6 product provides daily land surface temperature (LST) and emissivity values in a 1200 x 1200 kilometer grid. The temperature value is derived from the MOD11_L2 swath product. Above 30 degrees latitude, some pixels may have multiple observations where the criteria for clear-sky are met. When this occurs, the pixel value is the average of all qualifying observations. Provided along with both the day-time and night-time surface temperature bands and their quality indicator layers are MODIS bands 31 and 32 and six observation layers.
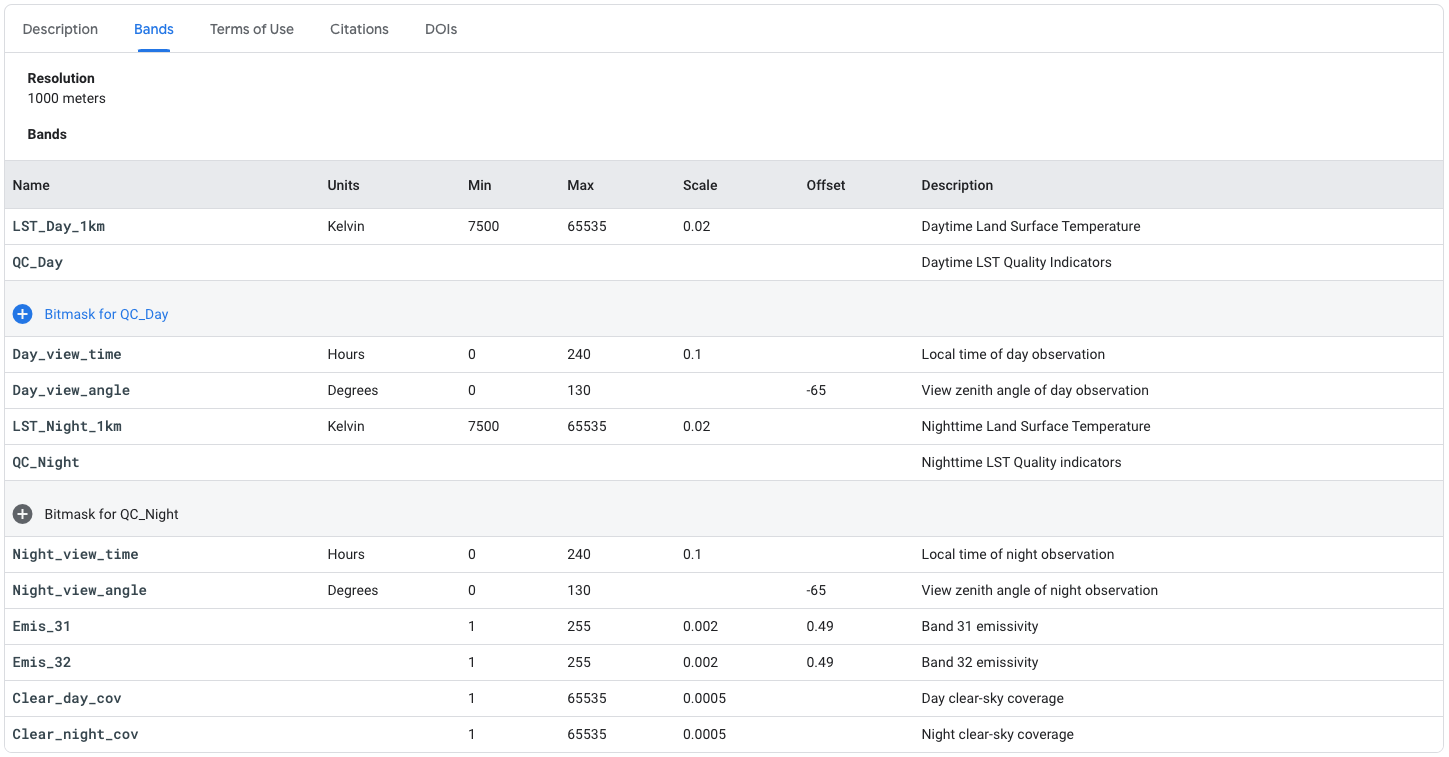
From above picture, we can see MOD11A1 has many bands. For this exercise, I only use 4 bands: LST_Day_1km, QC_Day, LST_Night_1km and QC_Night.
If you would like to test, you can access link from GEE: https://code.earthengine.google.com/?scriptPath=Examples:Datasets/MODIS_006_MOD11A1
Land Surface Temperature
Ok, let start! I need to define the geographic domain and the time range.
Add boundary layer as a guidance when overlaying LST data, and I can use US Department of State LSIB 2017 data in Earth Engine data catalog. https://developers.google.com/earth-engine/datasets/catalog/USDOS_LSIB_SIMPLE_2017?hl=en
I need a function to translate MODIS LST data to Celsius, with equation: Digital Number (DN) to Celsius = DN* 0.02 -273.15. I found an example of function written by Gennadii Donchyts at GEE Developers Group https://groups.google.com/g/google-earth-engine-developers/c/ebrSLPCjZ8c/m/TiL2gtSnDgAJ
Slightly different with code from above link, I will create two function, for LST_Day_1km and LST_Night_1km variable.
Next, I will add MOD11A1, select the LST and pre-process Quality Control Band
The tricky part will be considering only pixel with good quality from QC bitmask. From the catalog, we can see:
QC Bitmask
---
Bits 0-1: Mandatory QA flags
0: LST produced, good quality, not necessary to examine more detailed QA
1: LST produced, other quality, recommend examination of more detailed QA
2: LST not produced due to cloud effects
3: LST not produced primarily due to reasons other than cloud
Then I can use below script to select only the best quality images for each data. Below is the function for each Day and Night data.
As alternative way to get good quality image, I can use bitwiseExtract function from Daniel Wiell
Next, let’s apply above function to get all the image collection cleaned, only considering pixel with good quality. After that we can do mosaic Day and Night for further analysis.
Now I can calculate the annual Mean, Max and Min using below script.
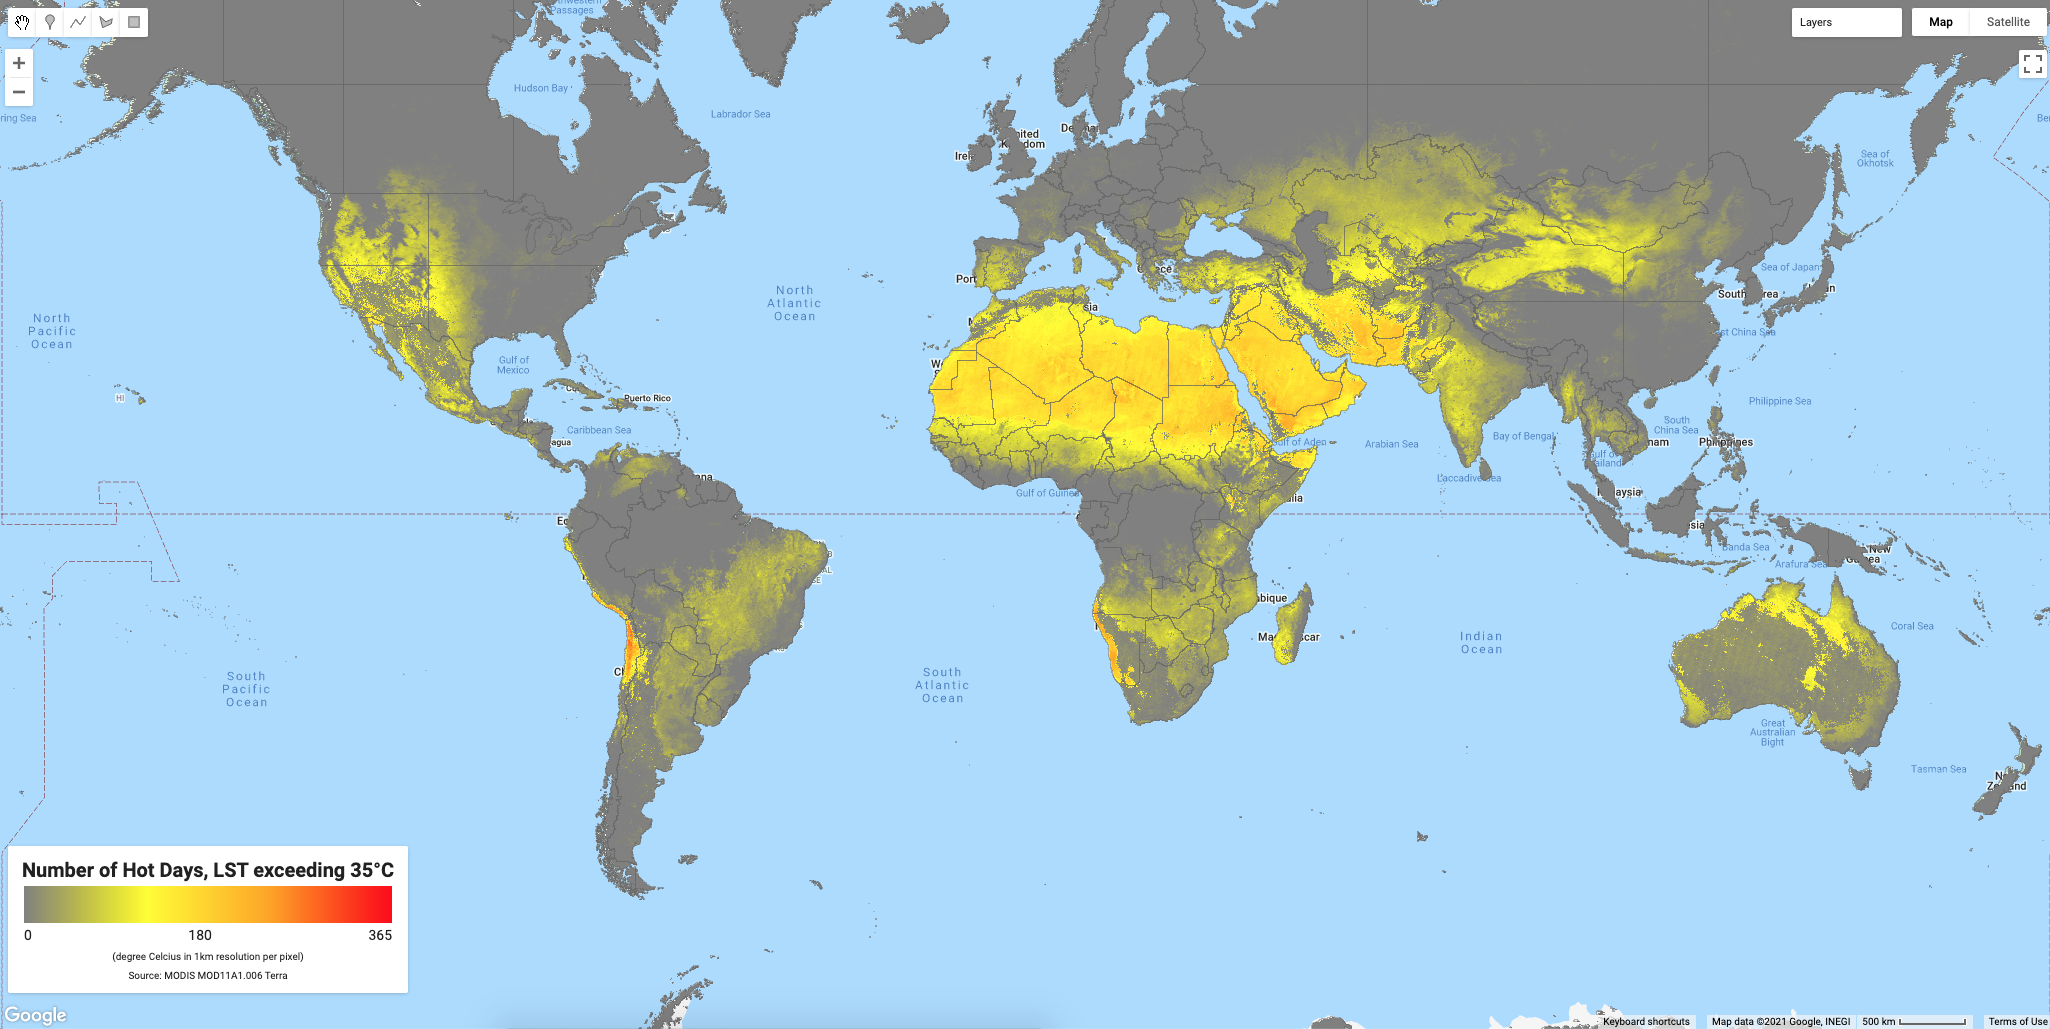
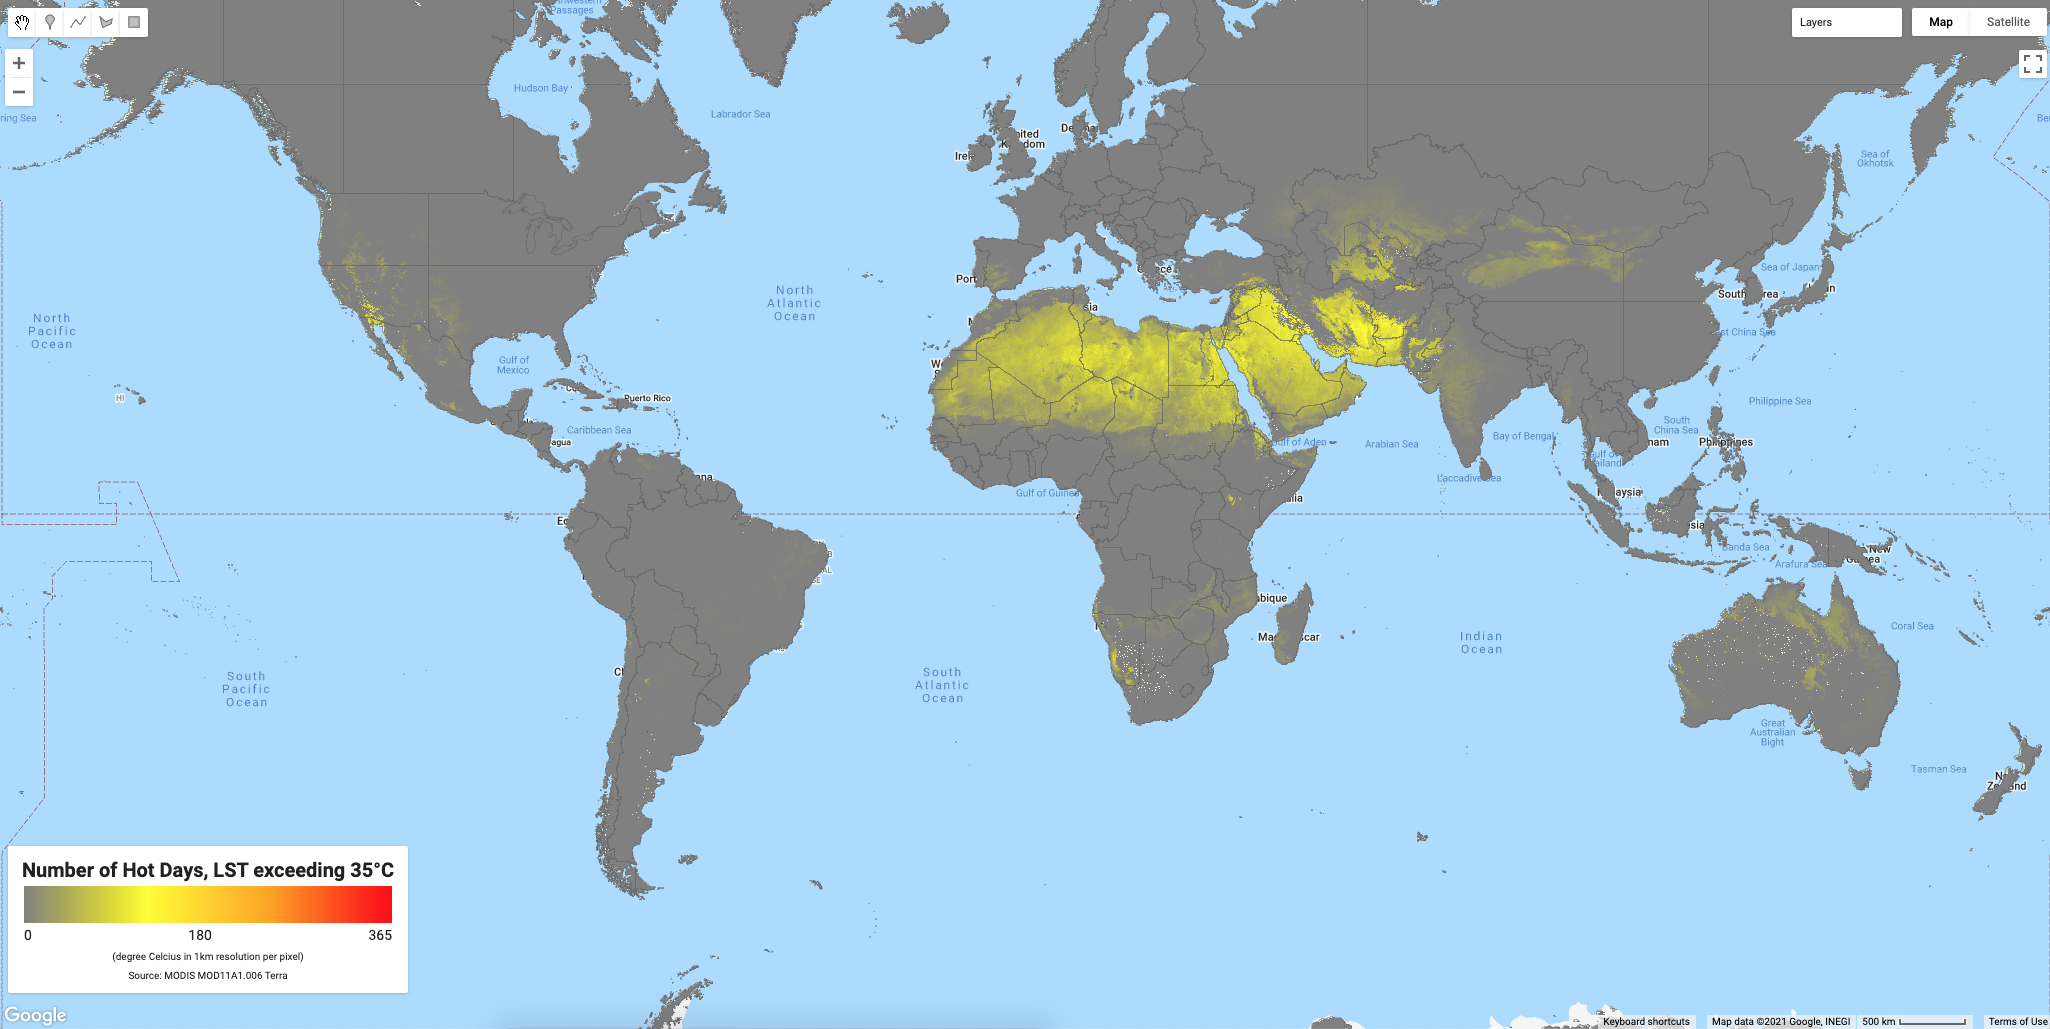
Hot Days
To get number of hot days in a year, I will use 35 degree Celsius as a threshold, so every LST exceeding the threshold, will added to new collection and later will summed to get total number in a year.
This case I try to get number of hot days using LST Day (average day time temperature) and LST Mean (average daily temperature - 24h average)
Number of Consecutive Hot Days
Although this is not part of my objective, I found a script to calculate number of consecutive hot days from Jamon Van Den Hoek at GEE Developers Group and I think this is still relevant with what I have done. So I decided to put this script too, maybe someday I need it.
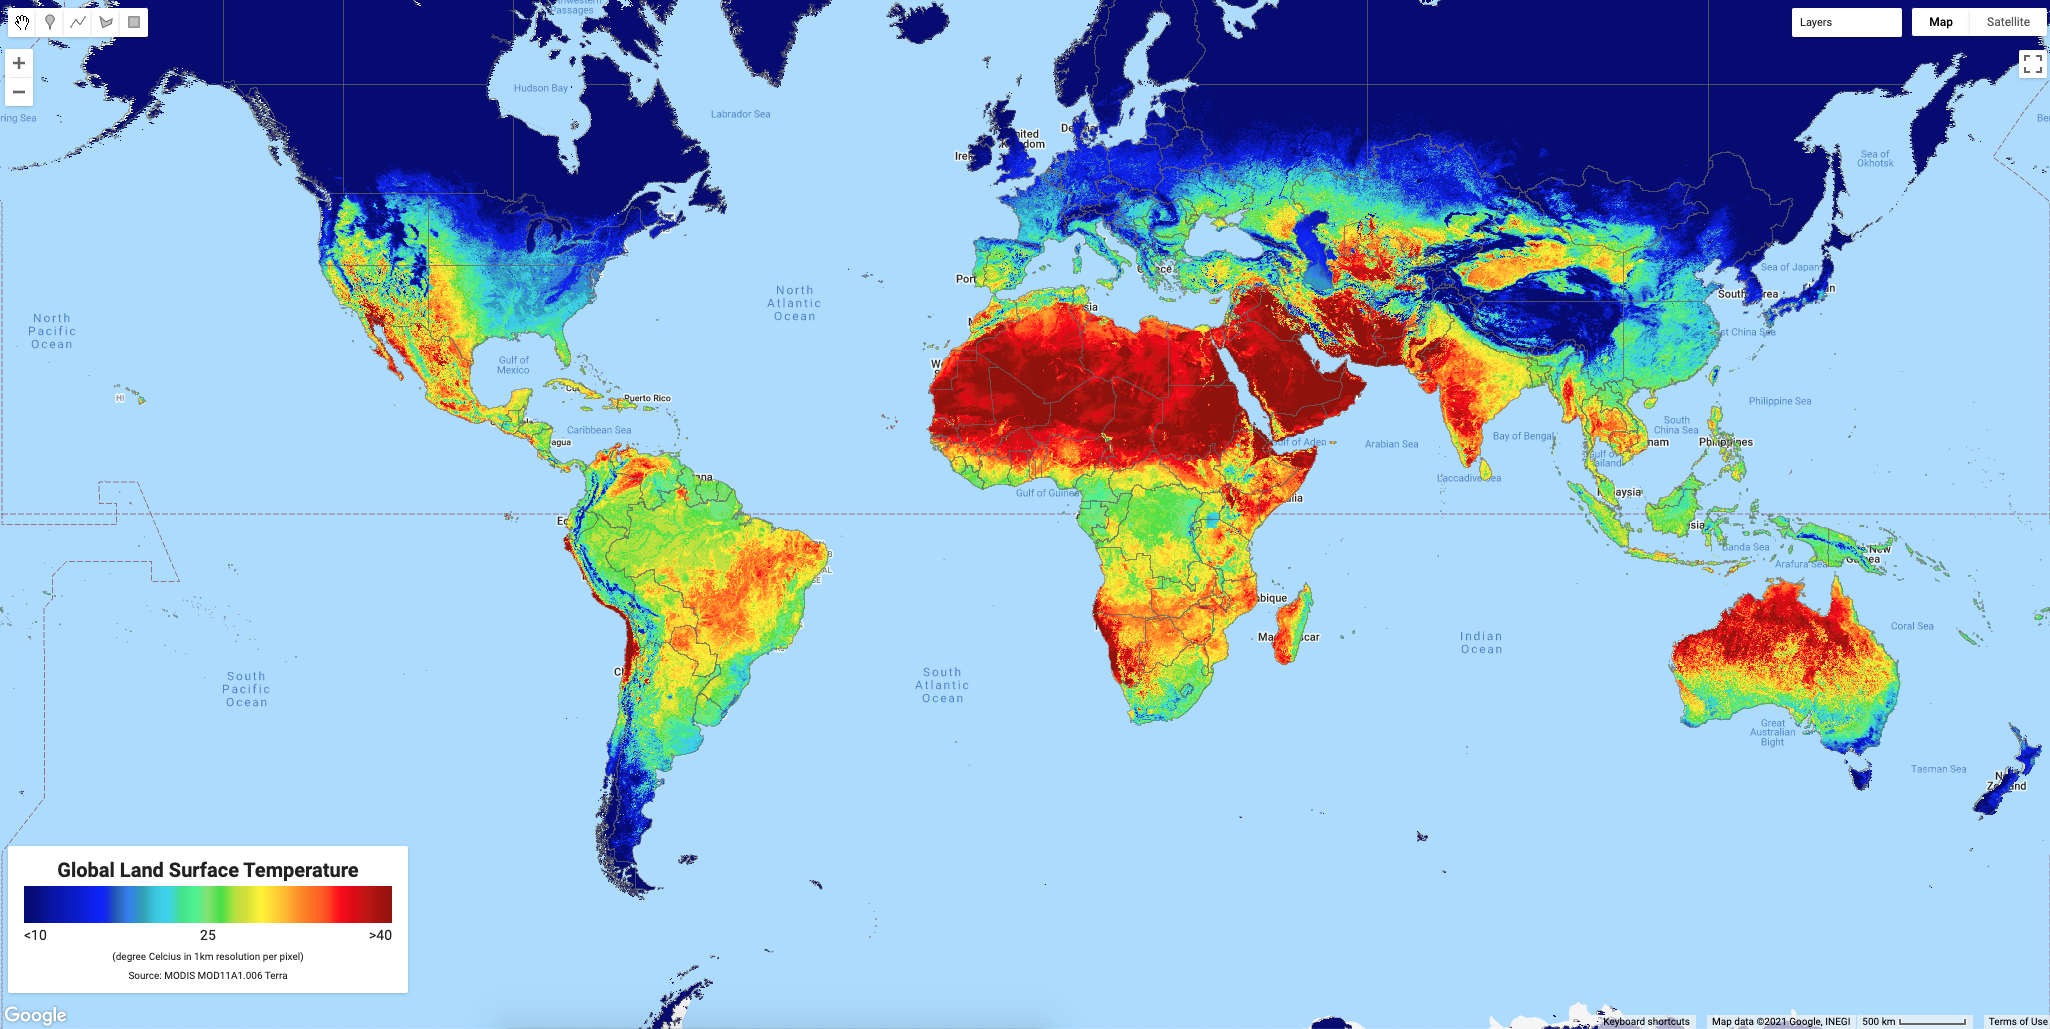
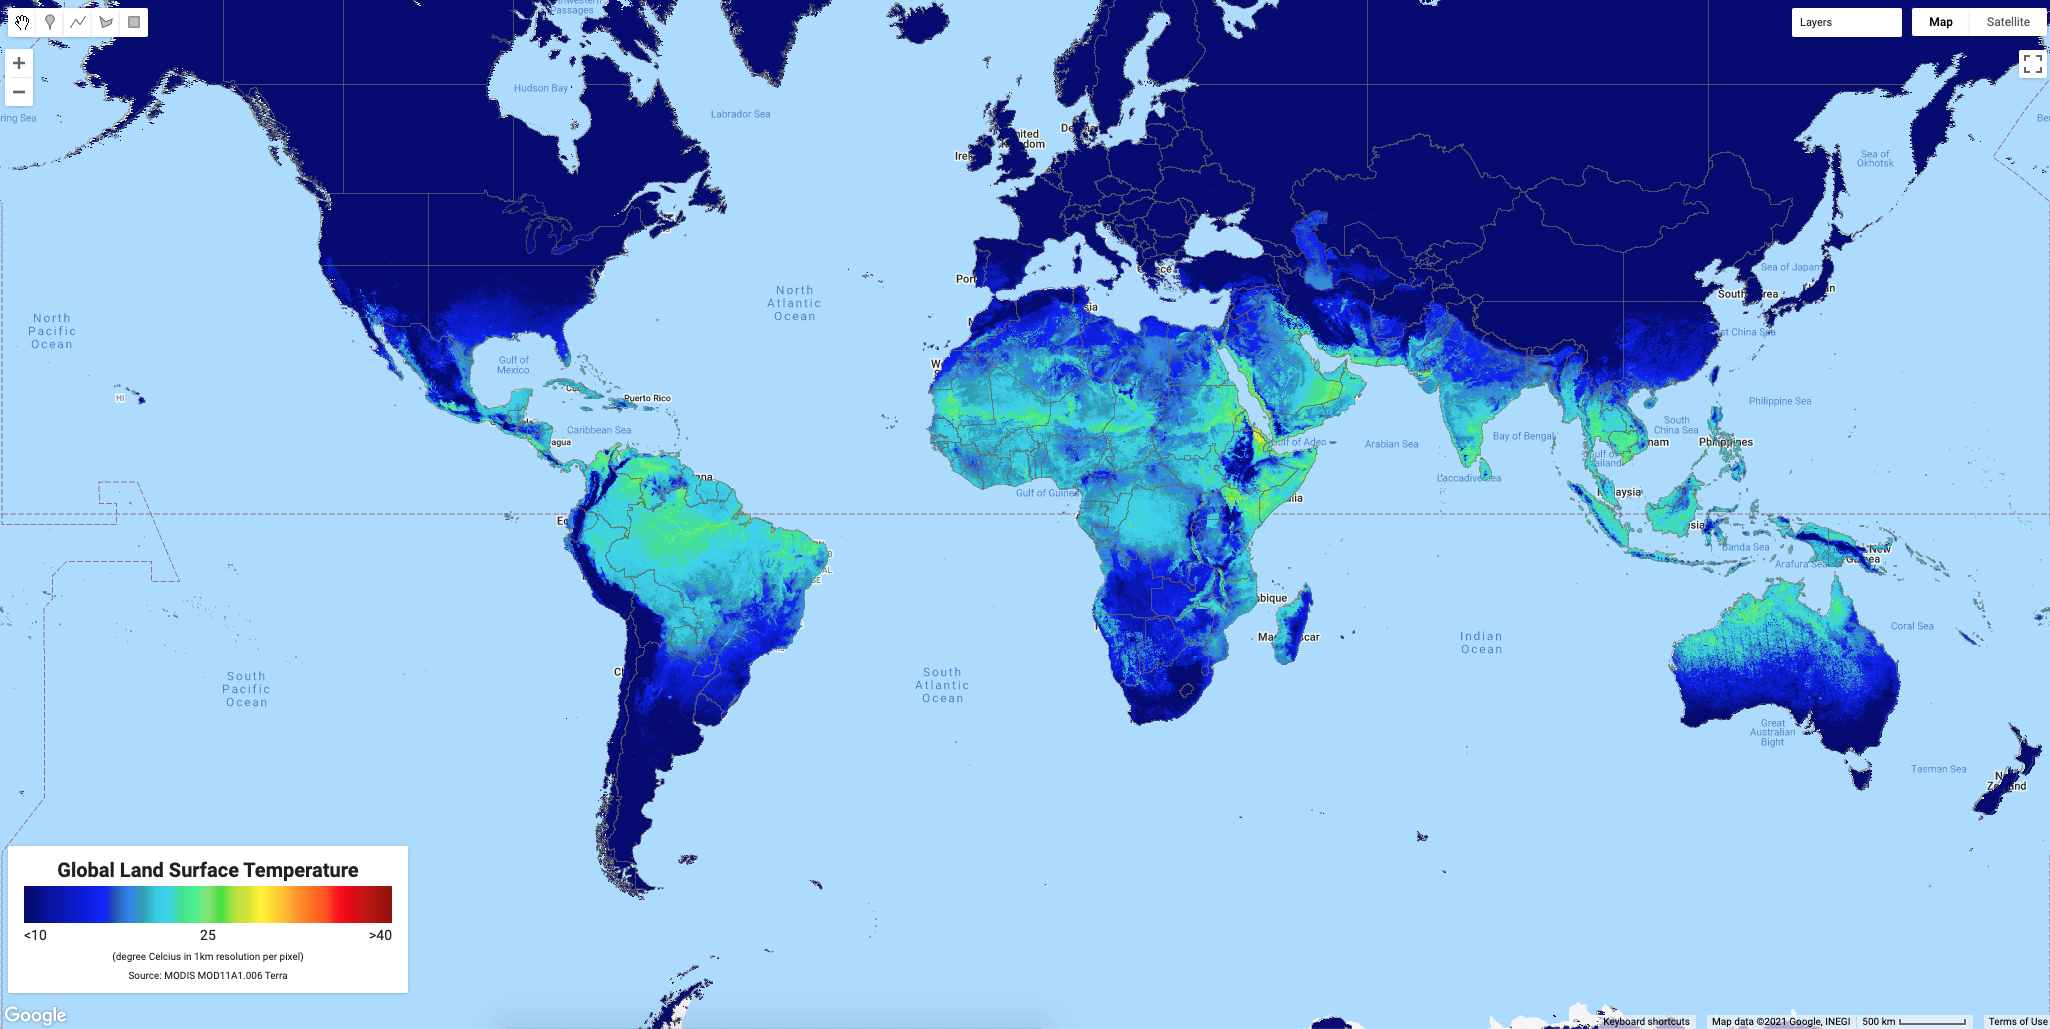
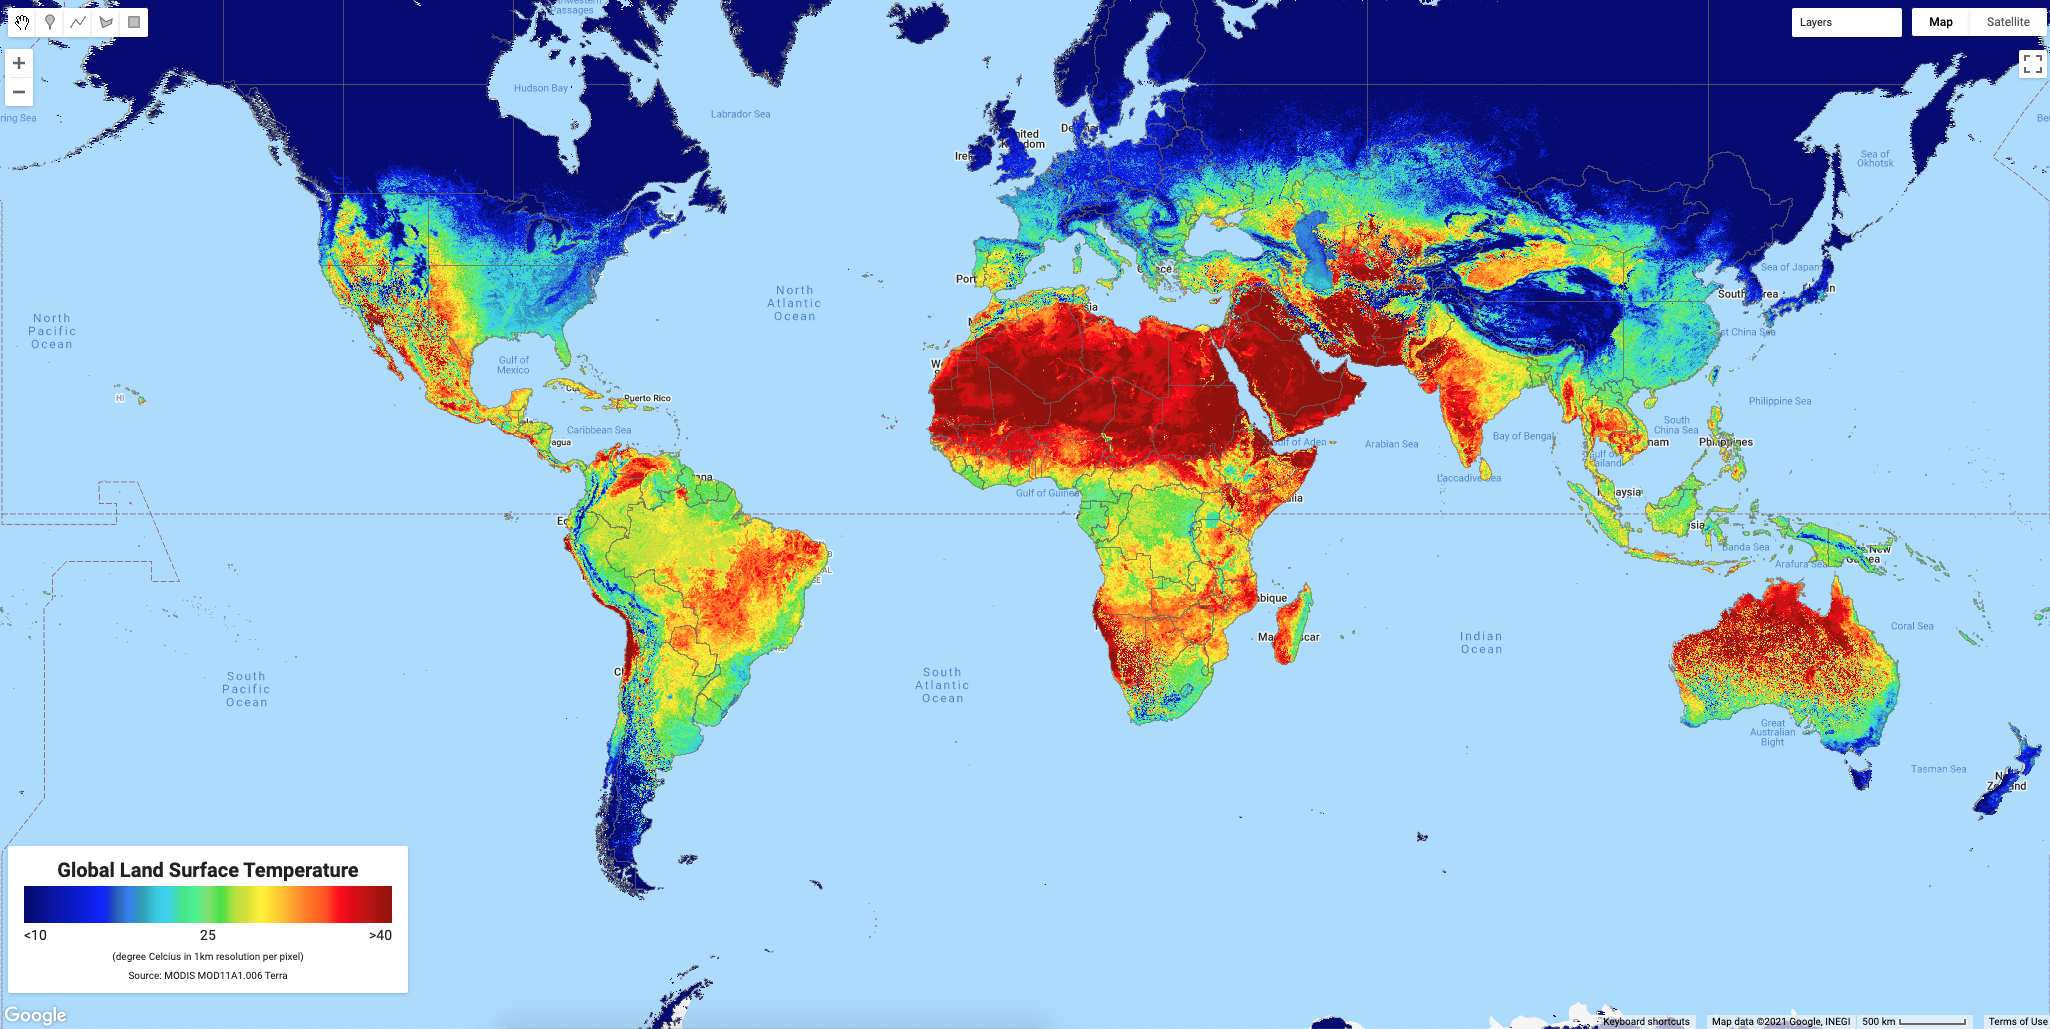
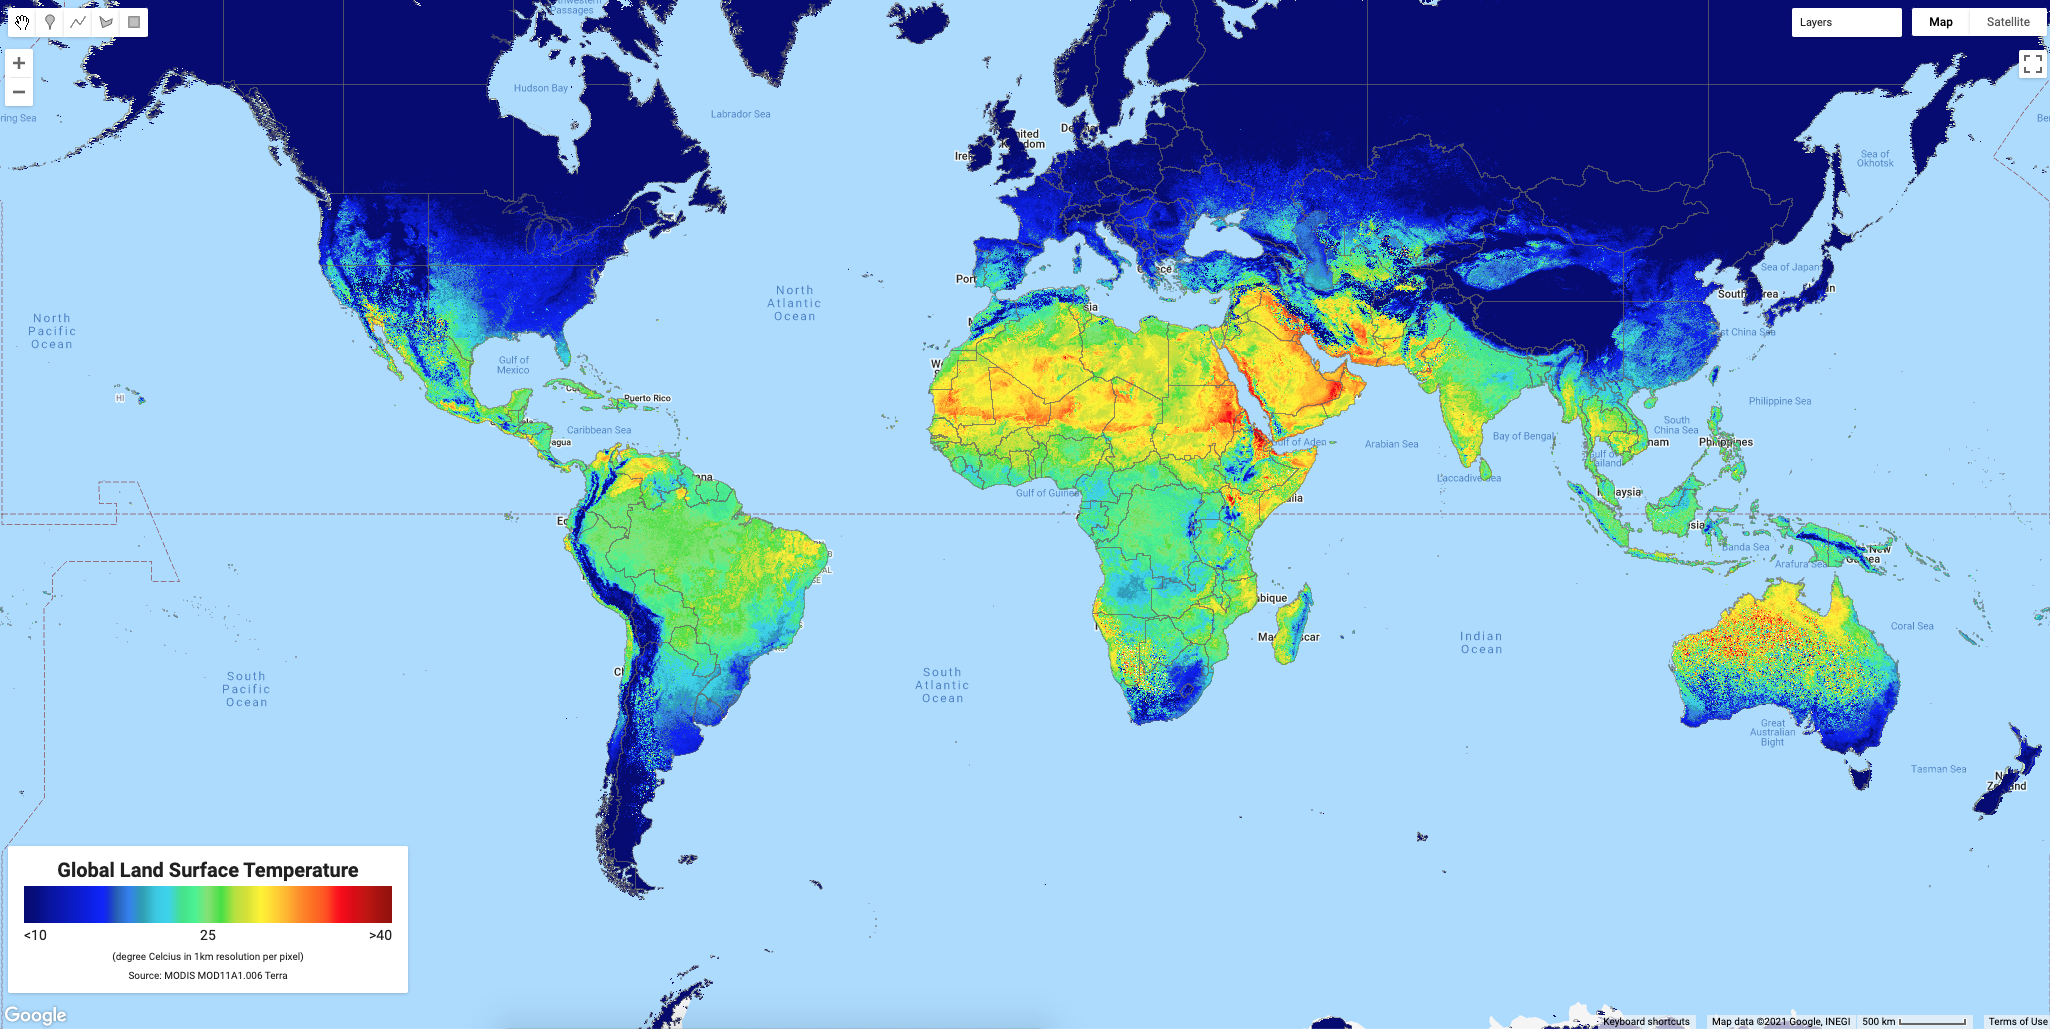
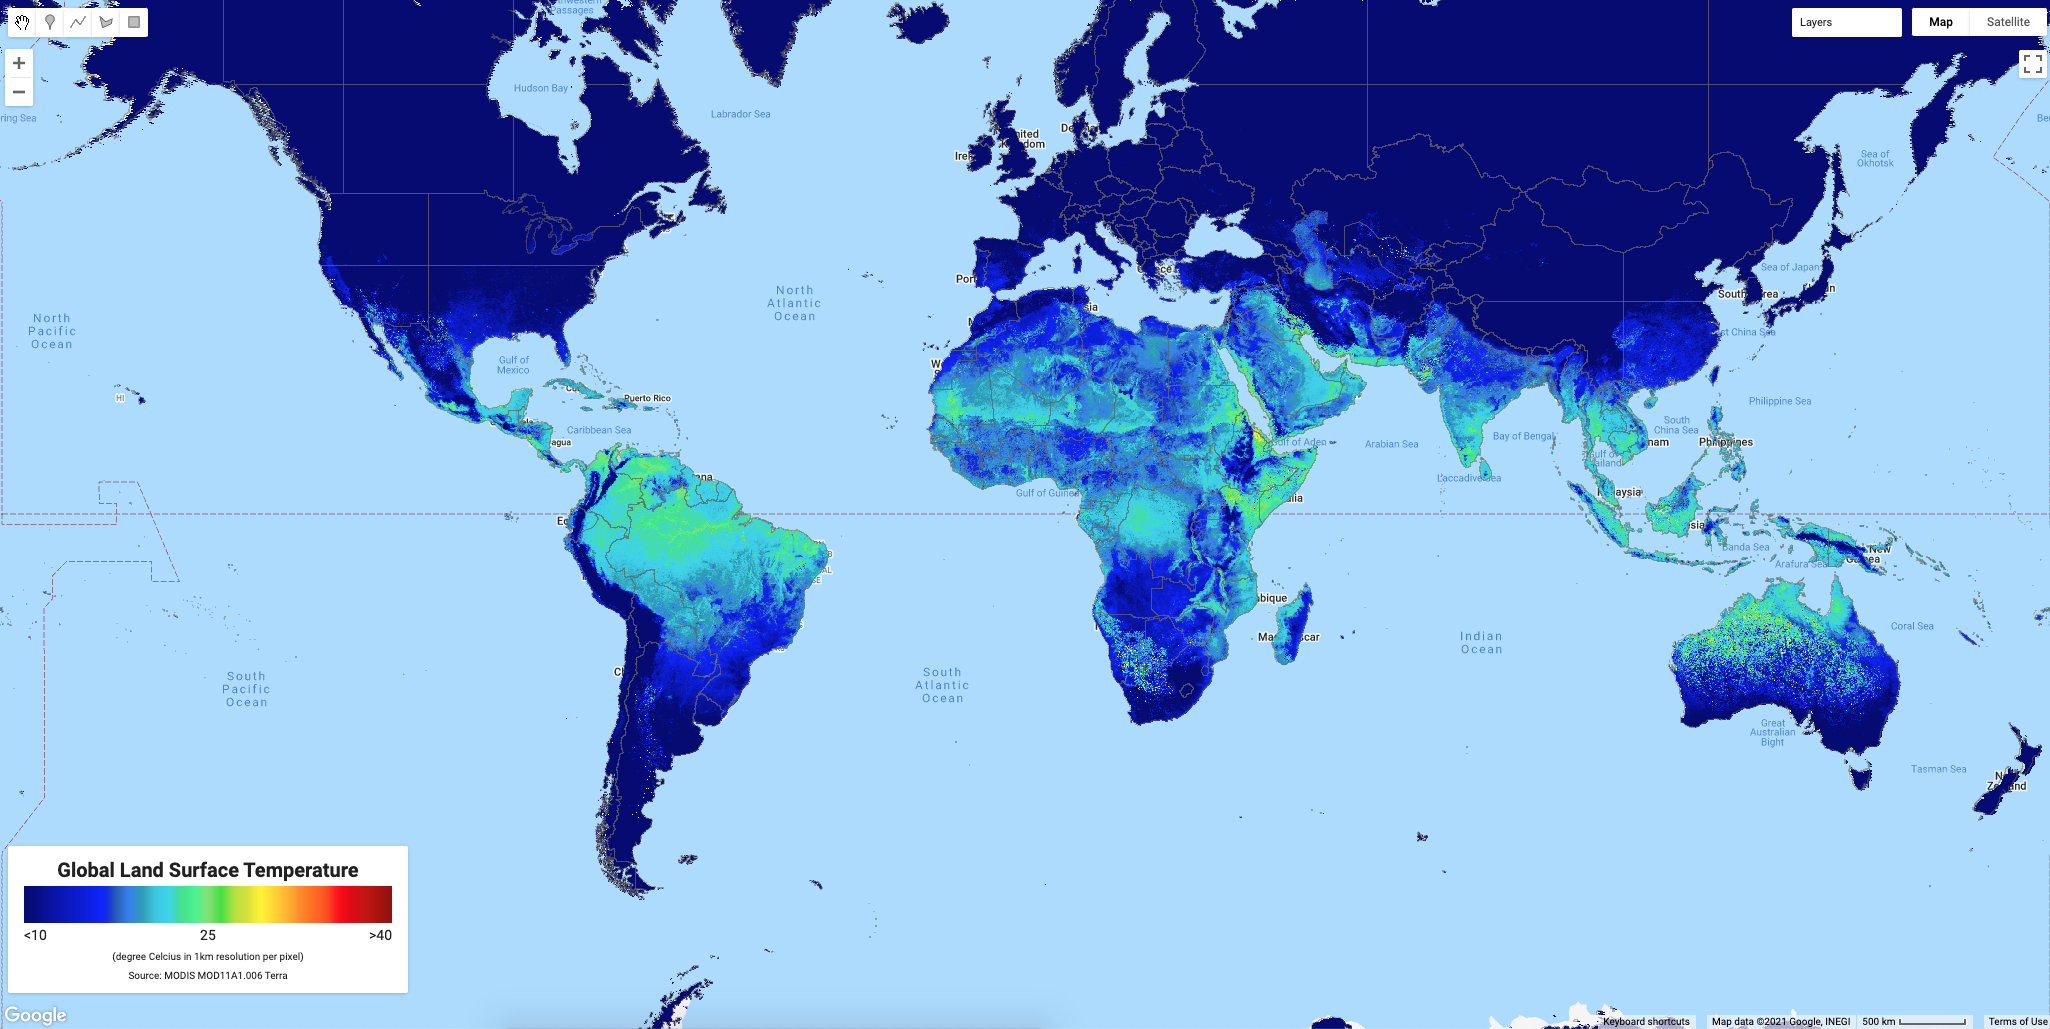
Symbology, Downloads and Legend
It’s time to visualize all the result and displaying into map with legend, and download it via Google Drive.
Full script available here: https://code.earthengine.google.com/f2109fc305e987b97503146d4c209871 (Update 22 Dec 2021)
And below is the example results.