Frequently asked questions
Short answers about xdssat, the case studies and the training, with links to the pages that go deeper.
About xdssat
Where does xdssat come from?
From a question I asked in 2018. At the DSSAT training in Chiang Mai, Thailand, I told Prof. Gerrit Hoogenboom what I was curious about: running DSSAT spatially, across a whole region, probably with Python. The interest was older. As an undergraduate I worked on the Shierary Rice model and its economic value, and that is when I was introduced to DSSAT. Later my work stayed close to crops, monitoring harvest and cultivation area, but never reached yield. xdssat closes that gap: the process-based DSSAT model, unchanged, driven by gridded data. It is a casual-weekend project, eight years after that conversation, and still experimental.
What is xdssat?
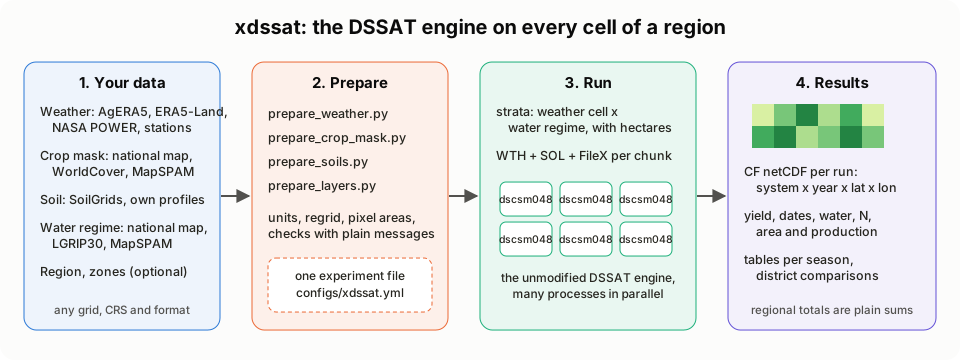
A bridge between the DSSAT crop model and Python. It writes the DSSAT engine’s own input files (experiment, weather, soil and cultivar files) for every grid cell and season of a region, runs the engine many times in parallel, and collects the results into one netCDF file that xarray can read. What xdssat is explains the idea; How xdssat differs from common DSSAT use compares it with running DSSAT one field at a time.
Is xdssat part of DSSAT?
No. xdssat is an independent project, not developed, endorsed or supported by the DSSAT Foundation. It uses the DSSAT engine as it is published. See Acknowledgements and how to cite.
Is xdssat ready to rely on?
It is experimental. It is tested on one main case study (rice in Java), five further case studies (maize after rice in East Java, millet in Niger, maize in Kenya, rice in the Mekong Delta and in northern Luzon), short runs in Sumatra, and the examples of the training modules. The repository has template experiments for rice, maize and pearl millet, and one rice-then-maize sequence. Use it at your own risk, and check its results against your own observations before relying on them. The licence (MPL-2.0) provides it “as is”, without warranty.
Does xdssat change the crop models?
No. It does not reimplement or patch the models: every simulated number comes from the unmodified DSSAT-CSM engine (dscsm048). xdssat only prepares the engine’s inputs and reads its outputs.
Which version of DSSAT does it use?
DSSAT-CSM 4.8. The engine on this site was built from version 4.8.6.4 of the published source code.
Do I need DSSAT installed?
You need the engine, in one of two ways: build it from source with scripts/build_engine.py (needs gfortran, cmake and make), or point xdssat at an existing DSSAT 4.8 installation on Windows. Both routes are in Getting started, section 2.
Which crops can it simulate?
The DSSAT engine covers many crops (48 crop codes in the files listed on the training page). xdssat builds every experiment file from a template experiment. The repository ships templates for rice (CERES-Rice), maize (CERES-Maize) and pearl millet (CERES-Millet), and one rice-then-maize crop sequence, all written by scripts/make_templates.py from DSSAT’s own experiments. Another crop needs its own template experiment and crop model (template section of the experiment file); Another crop walks through one.
Which regions can it run?
Any region for which the inputs are prepared: weather, a crop mask and soil are required; a water regime map, a region map and zones are optional (Input data). The area is the aoi section of the experiment file (name and box). The case studies in East Java (maize), Niger, Kenya, the Mekong Delta and northern Luzon, and runs in Lampung (Sumatra), use global datasets only.
Where do the weather and soil data come from?
From your own files or from global datasets: Input data lists what each input must be and the alternatives. The Java case study uses daily AgERA5 reanalysis from the Copernicus Climate Change Service (0.1°) and SoilGrids 2.0 texture and organic carbon at six depths, turned into DSSAT soil profiles with the Saxton and Rawls equations; everything is listed on the case study’s Data page.
How long does a run take?
The current case-study run simulated seasons ( strata in cells of Java, 1991-2020) in minutes, with engine processes in parallel. A quick test on 30 cells and 2 years takes about 20 seconds (Getting started, section 7). Preparing the inputs once takes longer: about 1.5 hours in total, mostly downloading and caching weather and soil data (section 6).
What does a run produce?
One netCDF file per run, on the weather grid (0.1° in the case studies), with yield, biomass, season length, water and nitrogen variables and the key dates for each water regime, season and cell. Its full structure is on How xdssat differs from common DSSAT use.
About the case studies
Why do the simulated yields differ from the official statistics?
A crop model simulates the yield its inputs allow. Official statistics record what farms harvested. In the case studies the two differ for reasons that come from the setup, from what the model leaves out, and from how they are compared:
- One crop map for every year. Each case places its crop with one static map: MapSPAM 2020, or the 2024 ATR/BPN rice fields for Java rice. The statistics count the area actually harvested each year, on every field where the crop grew. Another map moves the area and the production far more than the yield per hectare: weighting the Java maize cells by LGRIP30 cropland instead of MapSPAM rice gives 2.5 times the area and production, and area-weighted yields within 2%. Every case page has a “Crop map” switch that compares its MapSPAM map with LGRIP30 cropland in the same way; in northern Luzon, LGRIP30 puts 2% of its cropland above 800 m against 30% for MapSPAM rice. The Java rice case measures the same for other maps on Alternative input data.
- Seasons. A case simulates the seasons it sets, on fixed dates. Annual statistics add up every planting of the year.
- Fixed management. The planting date, the nitrogen rate and the plant density are the same in every cell and year. Farmers vary all three.
- Cultivars and calibration. The cultivars come from DSSAT’s cultivar files, with DSSAT’s own coefficients. Only the Java rice case is calibrated against statistics, through a soil fertility factor (SLPF); the other cases are not calibrated.
- What the model leaves out. In every template only water and nitrogen limit growth: phosphorus, potassium and diseases are switched off, and there are no pests or weeds. The simulated yields are closer to attainable yields than to farm yields.
- No change over time. The cultivar and the management stay the same over 30 years. The statistics include whatever changed on farms.
- Different areas and weights. A case’s box rarely matches the districts or the country of the statistics. The model weights cells by the crop area of the map; the statistics weight by harvested area.
- Grain basis. DSSAT reports grain yield as dry matter. Statistics report grain as harvested or at a standard moisture, and the sources used here do not always say which.
- Gridded inputs. Weather and soil at 0.1° average out local conditions.
The case studies therefore compare the model with itself: one date against another, one regime, cultivar or year against another. Their kilograms are not forecasts of farm yields. To use the levels, calibrate against observations first, as the Java rice case does on its Scientific method page.
Does the website run DSSAT in my browser?
No. The engine runs on the author’s machine; the pages read small CSV and JSON files exported from its results and draw the charts in the browser. The Rebuild notes show how those files are made.
About the training
Is this the official DSSAT training?
No. The DSSAT training section is adapted from the 2018 DSSAT training in Chiang Mai, Thailand, and follows its syllabus and exercises, but it is written for this site. The course’s slides and exercise sheets are not reproduced. For official training, see the DSSAT website.
Do I need xdssat to follow the training?
To read the pages, no: every chart is already computed. To run the notebooks yourself, yes: they use xdssat’s Python code to write the files and run the engine, plus the DSSAT example data (dssat-csm-data) next to this repository. The training overview lists what they need.
Why do some modules end with a map of Java?
Modules 1, 2, 3 and 5 close with a section called “From one field to a grid: xdssat”. It takes the module’s single-field idea (phenology, weather, soil water, yield risk) and shows it for every cell of the Java case study. That is the step xdssat adds to what the course teaches.
Using and citing
How do I cite xdssat and DSSAT?
Cite DSSAT as the DSSAT Foundation asks, and xdssat with the version you used. The exact references are on Acknowledgements and how to cite.
What is the licence?
xdssat is released under the Mozilla Public License 2.0. DSSAT and the data sets keep their own terms.
Where do I report a problem or ask a question?
In the xdssat issue tracker. Every page also has a “Report an issue” link. Questions about the DSSAT engine itself belong with the DSSAT team, but please do not send them problems that come from xdssat.