engine   : C:\TEMP\dsn\dssat\dscsm048.exe
csm-data : C:\Users\benny\OneDrive\Documents\Github\dssat-csm-data @ 99c95b34
FileX : https://github.com/DSSAT/dssat-csm-data/blob/99c95b340acb9515c2d0a8ab582f5fbbf076f345/Soybean/UFGA7901.SBXModule 2: growth processes, weather data, the DSSAT file system and cultivar coefficients
This notebook follows the second day of a DSSAT training course. It runs a soybean experiment with the CROPGRO model and looks inside the daily carbon balance, then works with weather files (quality checks, unit conversion, what happens when the weather changes), the files a DSSAT run needs, and the three levels of crop coefficients (species, ecotype, cultivar).
Data. Soybean experiment UFGA7901 (Gainesville, Florida, 1979; cultivar Bragg; irrigated and rainfed) with its weather and soil, from DSSAT/dssat-csm-data (BSD-3), pinned to one commit. The training’s own weather spreadsheet is not used; the unit-conversion exercise starts from the published weather file instead.
Needs. As in module 1: the DSSAT engine, a short work folder outside OneDrive, dssat-csm-data next to this repository. Results go to the work folder and to small CSV files in docs/learn/data/module2/.
1. Growth processes
Run the experiment
UFGA7901 has two treatments: irrigated and rainfed Bragg soybean, planted on 19 June 1979.
2 treatments in 0.8 s, model CRGRO048| TRNO | TNAM | PDAT | ADAT | MDAT | HWAM | CWAM | LAIX | PRCM | IRCM | ETCM | NFXM | |
|---|---|---|---|---|---|---|---|---|---|---|---|---|
| 0 | 1 | 79 IRRIG. BRAGG | 1979170 | 1979213 | 1979285 | 3114 | 6314 | 5.537128 | 695 | 113 | 461 | 302 |
| 1 | 2 | 79 RAINFED BRAGG | 1979170 | 1979213 | 1979285 | 3061 | 5994 | 5.282708 | 695 | 0 | 442 | 294 |
| TRNO | treatment | variable | simulated | observed | sim/obs | |
|---|---|---|---|---|---|---|
| 0 | 1 | irrigated | Seed yield, kg/ha | 3114.00 | 2891.00 | 1.08 |
| 1 | 1 | irrigated | Tops weight, kg/ha | 6314.00 | 5781.00 | 1.09 |
| 2 | 1 | irrigated | Pod weight, kg/ha | 3987.00 | 3734.00 | 1.07 |
| 3 | 1 | irrigated | LAI, maximum | 5.54 | 4.71 | 1.18 |
| 4 | 1 | irrigated | Seed size, g | 152.17 | 163.80 | 0.93 |
| 5 | 1 | irrigated | First flower (R1), DAP | 43.00 | 43.00 | 1.00 |
| 6 | 1 | irrigated | Maturity, DAP | 115.00 | 119.00 | 0.97 |
| 7 | 2 | rainfed | Seed yield, kg/ha | 3061.00 | 2883.00 | 1.06 |
| 8 | 2 | rainfed | Tops weight, kg/ha | 5994.00 | 5534.00 | 1.08 |
| 9 | 2 | rainfed | Pod weight, kg/ha | 3920.00 | 3755.00 | 1.04 |
| 10 | 2 | rainfed | LAI, maximum | 5.28 | 4.36 | 1.21 |
| 11 | 2 | rainfed | Seed size, g | 152.70 | 157.80 | 0.97 |
| 12 | 2 | rainfed | First flower (R1), DAP | 43.00 | 45.00 | 0.96 |
| 13 | 2 | rainfed | Maturity, DAP | 115.00 | 119.00 | 0.97 |
The daily carbon balance
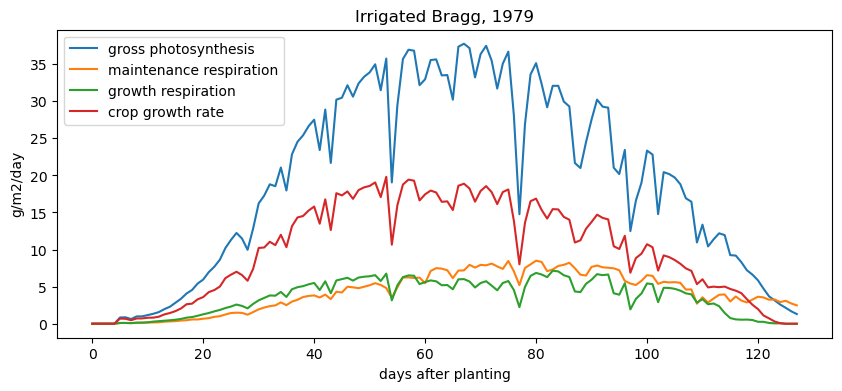
CROPGRO computes gross photosynthesis every day, takes off maintenance respiration (a part proportional to the plant’s mass and a part proportional to the day’s photosynthesis, RESPIR.for:54), and turns what is left into new tissue, losing growth respiration in the conversion. With the PHOTO method L of this experiment the gross photosynthesis comes from an hourly leaf-level calculation in the soil-plant-atmosphere module (CROPGRO.for:748-758); with C it is the daily canopy equation of PHOTO.for:225, which multiplies a light-limited rate by 0-1 factors for soil fertility (SLPF), temperature, leaf N, water and CO2.
The daily output file PlantC reports these terms in g CH2O per m2 per day.
| PHAD | MRAD | GRAD | CGRD | respired share | |
|---|---|---|---|---|---|
| TRNO | |||||
| 1 | 2445.16 | 541.0 | 457.58 | 1258.55 | 0.41 |
| 2 | 2379.05 | 524.5 | 447.97 | 1225.09 | 0.41 |
Where the new mass goes: partitioning
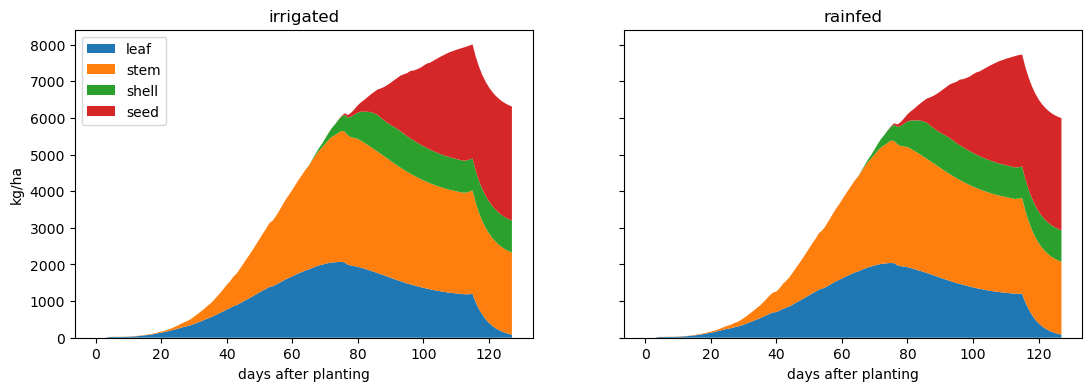
Each day the new dry matter is shared between leaves, stems, roots and (after flowering) pods and seeds, in proportions that change with the growth stage. The FileT holds field samples of the same organs.
| rmse | d | |||
|---|---|---|---|---|
| TRNO | 1 | 2 | 1 | 2 |
| variable | ||||
| CWAD | 567.31 | 874.36 | 0.99 | 0.97 |
| GWAD | 196.34 | 367.94 | 0.99 | 0.97 |
| LAID | 0.57 | 0.69 | 0.97 | 0.96 |
| LWAD | 199.86 | 266.20 | 0.98 | 0.95 |
| PWAD | 284.00 | 487.53 | 0.99 | 0.97 |
| SWAD | 381.54 | 472.34 | 0.97 | 0.95 |
Light interception
Gross photosynthesis depends first on how much light the canopy intercepts. The engine reports the intercepted share of PAR (LI%D) and the leaf area index; Beer’s law, LI = 1 - exp(-k LAI), gives an extinction coefficient k that summarises the canopy.
fitted extinction coefficient k = 0.720 from 238 daysWater stress
The rainfed treatment had the same weather but no irrigation. Two 0-1 factors in PlantGro show when water was short: WSPD (photosynthesis) and WSGD (expansion, partitioning and development). In CROPGRO’s PlantGro these are written as 1 - factor (Opgrow.for:277-278): 0 means no stress, 1 means growth stopped.
| WSPD | WSGD | |||
|---|---|---|---|---|
| mean | max | mean | max | |
| TRNO | ||||
| 1 | 0.00 | 0.00 | 0.00 | 0.17 |
| 2 | 0.01 | 0.38 | 0.03 | 0.58 |
Two ways to compute photosynthesis
The same experiment with the daily canopy method (PHOTO = C) instead of the hourly leaf method:
| treatment | HWAM_L | HWAM_C | CWAM_L | CWAM_C | obs_HWAM | |
|---|---|---|---|---|---|---|
| 0 | irrigated | 3114.0 | 2899.0 | 6314.0 | 6264.0 | 2891.0 |
| 1 | rainfed | 3061.0 | 2854.0 | 5994.0 | 5965.0 | 2883.0 |
WindowsPath('C:/Users/benny/OneDrive/Documents/Github/xdssat/docs/learn/data/module2/photo_method.csv')The effect of CO2 on growth
Photosynthesis responds to the CO2 concentration of the air, and differently in C3 crops (soybean) and C4 crops (maize). The environmental modification column ECO2 of an experiment file can replace the CO2 of every day with a fixed value (R and the value, in ppm). The irrigated soybean of UFGA7901 and the irrigated, high-N maize of UFGA8201 are run at six concentrations, one treatment per concentration.
| crop | maize (C4) | soybean (C3) |
|---|---|---|
| CO2 | ||
| 280 | 0.897 | 0.820 |
| 330 | 0.987 | 0.921 |
| 380 | 1.000 | 1.000 |
| 450 | 1.016 | 1.074 |
| 550 | 1.031 | 1.157 |
| 700 | 1.039 | 1.238 |
2. Weather data
A DSSAT weather file holds one station header (code, latitude, longitude, elevation, TAV the mean annual temperature and AMP the amplitude of monthly mean temperatures) and one row per day with at least solar radiation (MJ/m2/day), maximum and minimum temperature (°C) and rain (mm). The shell’s WeatherMan tool imports, checks and converts such data; here pandas and src/wth.py do the same.
Quality checks
{'INSI': 'UFGA', 'LAT': 29.63, 'LONG': -82.37, 'ELEV': 10.0, 'TAV': 20.9, 'AMP': 13.0, 'REFHT': 2.0, 'WNDHT': 3.0}| check | count | |
|---|---|---|
| 0 | days in file | 365 |
| 1 | missing values (any of SRAD, TMAX, TMIN, RAIN) | 0 |
| 2 | TMAX below TMIN | 0 |
| 3 | negative rain | 0 |
| 4 | SRAD below 0 or above 35 MJ/m2/day | 0 |
| 5 | TMAX above 45 or TMIN below -20 °C | 0 |
| 6 | day-to-day TMAX change above 15 °C | 1 |
| 7 | gaps in the dates | 0 |
| what | header | recomputed | |
|---|---|---|---|
| 0 | TAV, °C | 20.9 | 20.99 |
| 1 | AMP, °C | 13.0 | 16.09 |
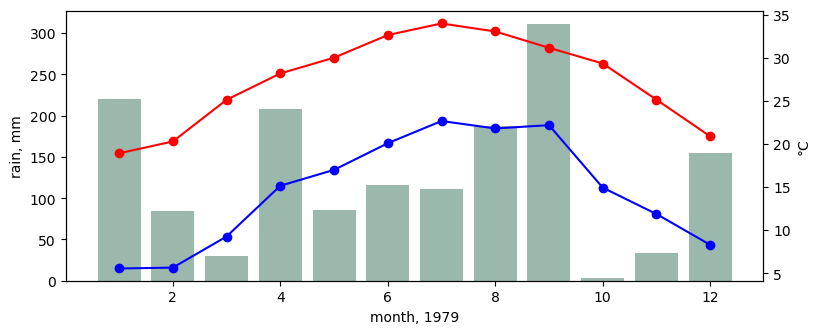
| month | TMAX | TMIN | SRAD | RAIN | raindays | |
|---|---|---|---|---|---|---|
| 0 | 1 | 18.9 | 5.5 | 10.2 | 220.6 | 9 |
| 1 | 2 | 20.3 | 5.6 | 11.9 | 84.9 | 6 |
| 2 | 3 | 25.1 | 9.2 | 18.2 | 29.7 | 4 |
| 3 | 4 | 28.2 | 15.1 | 19.1 | 207.8 | 7 |
| 4 | 5 | 30.0 | 17.0 | 21.3 | 85.4 | 10 |
| 5 | 6 | 32.6 | 20.1 | 20.4 | 115.7 | 10 |
| 6 | 7 | 34.0 | 22.6 | 21.1 | 111.2 | 18 |
| 7 | 8 | 33.0 | 21.8 | 19.3 | 187.7 | 14 |
| 8 | 9 | 31.1 | 22.2 | 14.2 | 310.8 | 18 |
| 9 | 10 | 29.3 | 14.9 | 16.7 | 2.8 | 3 |
| 10 | 11 | 25.1 | 11.9 | 12.5 | 33.6 | 6 |
| 11 | 12 | 20.9 | 8.3 | 9.8 | 154.9 | 9 |
The WeatherMan exercise: weather from Griffin, Georgia
The course hands out daily weather of an experiment station at Griffin, Georgia, as a spreadsheet (course-data/GRGR-Raw.xls): the date as YYDDD, rain in inches, maximum and minimum temperature in °F and solar radiation in cal/cm² (langleys). The exercise gives the station as latitude 33°16’ N, longitude 84°17’ W, elevation 299 m. WeatherMan converts the units, checks the data and writes one DSSAT weather file per year, GRGR9201.WTH to GRGR9901.WTH; here pandas and wth.write_wth do the same.
2696 days, 01 Jan 1992 to 19 May 1999
 YYDDD  rain_in  tmax_F  tmin_F  srad_ly       date
 92001     0.00    50.5    35.1   138.62 1992-01-01
 92002     1.37    49.3    40.6    59.75 1992-01-02
 92003     0.35    53.8    42.1   126.67 1992-01-03
 92004     0.00    61.9    42.6   255.74 1992-01-04
92005 0.00 53.4 42.1 162.52 1992-01-05| check | count | |
|---|---|---|
| 0 | days in the spreadsheet | 2696 |
| 1 | duplicate dates | 0 |
| 2 | days missing between first and last date | 0 |
| 3 | missing values | 0 |
| 4 | TMAX below TMIN | 0 |
| 5 | negative rain | 0 |
| 6 | SRAD below 0 or above 35 MJ/m2/day | 0 |
days filled by interpolation (temperature, radiation) or as no rain: 0; TAV 16.2, AMP 19.3
*WEATHER : Experiment, Georgia, USA (course data, converted)

@ INSI      LAT     LONG  ELEV   TAV   AMP REFHT WNDHT
  GRGR   33.267  -84.283   299  16.2  19.3   -99   -99
@DATE  SRAD  TMAX  TMIN  RAIN
92001   5.8  10.3   1.7   0.0
92002 2.5 9.6 4.8 34.8| file | days | first | last | |
|---|---|---|---|---|
| 0 | GRGR9201.WTH | 366 | 1992-01-01 | 1992-12-31 |
| 1 | GRGR9301.WTH | 365 | 1993-01-01 | 1993-12-31 |
| 2 | GRGR9401.WTH | 365 | 1994-01-01 | 1994-12-31 |
| 3 | GRGR9501.WTH | 365 | 1995-01-01 | 1995-12-31 |
| 4 | GRGR9601.WTH | 366 | 1996-01-01 | 1996-12-31 |
| 5 | GRGR9701.WTH | 365 | 1997-01-01 | 1997-12-31 |
| 6 | GRGR9801.WTH | 365 | 1998-01-01 | 1998-12-31 |
| 7 | GRGR9901.WTH | 139 | 1999-01-01 | 1999-05-19 |
Self test 1 of the exercise: run the first treatment of the maize experiment UFGA8201 with the new weather. The Griffin record covers 1992-1999, not 1982, so the experiment is planted on 26 February of each year from 1992 to 1998 (all its dates move with planting), next to Gainesville 1982.
| cell | PDAT | ADAT | MDAT | HWAM | CWAM | PRCM | ETCM | TMAXA | TMINA | SRADA | season_days | |
|---|---|---|---|---|---|---|---|---|---|---|---|---|
| 0 | UFGA 1982 | 1982057 | 1982133 | 1982185 | 2293 | 6556 | 661 | 290 | 29.332031 | 16.024216 | 18.540625 | 128 |
| 1 | GRGR 1992 | 1992057 | 1992167 | 1992222 | 6924 | 11795 | 471 | 346 | 25.061211 | 13.146670 | 19.460003 | 165 |
| 2 | GRGR 1993 | 1993057 | 1993167 | 1993218 | 1464 | 4183 | 426 | 239 | 25.719259 | 13.336024 | 20.972052 | 161 |
| 3 | GRGR 1994 | 1994057 | 1994159 | 1994216 | 6703 | 12884 | 1069 | 422 | 25.617609 | 13.870437 | 19.800003 | 159 |
| 4 | GRGR 1995 | 1995057 | 1995155 | 1995211 | 4218 | 9585 | 289 | 265 | 26.640911 | 13.874025 | 20.588306 | 154 |
| 5 | GRGR 1996 | 1996057 | 1996167 | 1996220 | 3687 | 9596 | 497 | 291 | 25.870558 | 12.854602 | 20.098162 | 163 |
| 6 | GRGR 1997 | 1997057 | 1997162 | 1997218 | 6446 | 13021 | 632 | 382 | 25.588198 | 12.955901 | 19.718630 | 161 |
| 7 | GRGR 1998 | 1998057 | 1998158 | 1998209 | 3418 | 6425 | 562 | 267 | 26.531584 | 13.650656 | 20.226971 | 152 |
WindowsPath('C:/Users/benny/OneDrive/Documents/Github/xdssat/docs/learn/data/module2/grgr_maize.csv')Converting back and forth: an optional column matters
Station data often come in other units: °F, inches of rain, radiation in langleys (cal/cm2/day). To show the conversion WeatherMan does on import, the published file is turned into such a table, converted back with the standard factors (1 inch = 25.4 mm, 1 langley = 0.04184 MJ/m2) and written as a new DSSAT file with wth.write_wth, which also recomputes TAV and AMP. This file also has a PAR column (photosynthetically active radiation, mol/m2/day); the conversion is done twice, once keeping it and once without it, and the soybean experiment is run on each new file.
C:\TEMP\ipykernel_46484\1818243184.py:2: UserWarning: obj.round has no effect with datetime, timedelta, or period dtypes. Use obj.dt.round(...) instead.
  "rain_in": w.RAIN / 25.4, "srad_ly": w.SRAD / 0.04184}).round(2)
date tmax_F tmin_F rain_in srad_ly
date
1979-01-01 1979-01-01 80.96 57.92 0.00 239.01
1979-01-02 1979-01-02 78.98 46.04 1.35 62.14
1979-01-03 1979-01-03 46.04 23.00 0.00 296.37
1979-01-04 1979-01-04 50.00 26.96 0.00 246.18
1979-01-05 1979-01-05 69.98 39.02 0.00 270.08
TAV/AMP of the new file: 21.0 16.1| variable | value | |
|---|---|---|
| 0 | SRAD, largest change | 0.0 |
| 1 | TMAX, largest change | 0.0 |
| 2 | TMIN, largest change | 0.0 |
| 3 | RAIN, largest change | 0.1 |
| 4 | seed yield irrigated, original file | 3114.0 |
| 5 | seed yield rainfed, original file | 3061.0 |
| 6 | seed yield irrigated, converted, PAR kept | 3114.0 |
| 7 | seed yield rainfed, converted, PAR kept | 3063.0 |
| 8 | seed yield irrigated, converted, no PAR | 3187.0 |
| 9 | seed yield rainfed, converted, no PAR | 3135.0 |
What if the weather were different?
Each scenario changes the weather file and reruns both treatments: radiation (SRAD and PAR) scaled by 0.8 to 1.2, all temperatures raised by 2 or 4 °C, and rain halved or raised by half. This is what the environmental modification section of a FileX does inside the engine; editing the file keeps the change visible.
| treatment | irrigated | rainfed |
|---|---|---|
| scenario | ||
| SRAD x 0.8 | 2627.0 | 2628.0 |
| SRAD x 0.9 | 2898.0 | 2874.0 |
| SRAD x 1.1 | 3274.0 | 3173.0 |
| SRAD x 1.2 | 3421.0 | 3254.0 |
| baseline | 3114.0 | 3063.0 |
| rain x 0.5 | 2912.0 | 2203.0 |
| rain x 1.5 | 3105.0 | 3098.0 |
| temperature +2 °C | 2848.0 | 2781.0 |
| temperature +4 °C | 2589.0 | 2431.0 |
WindowsPath('C:/Users/benny/OneDrive/Documents/Github/xdssat/docs/learn/data/module2/weather_sens.csv')3. The minimum data set and the DSSAT file system
A run needs a minimum data set: site and soil, daily weather, management, and the crop’s coefficients. Each lives in its own text file. These are the files the base run above used, and what each holds:
| file | role | lines | source | |
|---|---|---|---|---|
| 0 | SOIL.SOL | soil profiles (many per file) | 1981 | dssat-csm-data |
| 1 | UFGA7901.SBA | FileA: observed end-of-season data | 12 | dssat-csm-data |
| 2 | UFGA7901.SBT | FileT: observed data during the season | 60 | dssat-csm-data |
| 3 | UFGA7901.SBX | FileX: experiment (treatments, management, sim... | 134 | dssat-csm-data |
| 4 | UFGA7901.WTH | daily weather of one station and year(s) | 370 | dssat-csm-data |
| 5 | SBGRO048.CUL | cultivar coefficients | 129 | engine Genotype folder |
| 6 | SBGRO048.ECO | ecotype coefficients | 82 | engine Genotype folder |
| 7 | SBGRO048.SPE | species coefficients | 174 | engine Genotype folder |
Experiment files are named IIssYYnn.ccX: institute (UF), site (GA), two-digit year (79), experiment number (01), and a crop code (SB soybean) plus X, A or T. The same name with .WTH is the weather. Counting the experiment files shipped with DSSAT, per crop folder:
300 experiment files in 53 folders| part | value | |
|---|---|---|
| 0 | institute | UF |
| 1 | site | GA |
| 2 | year | 79 |
| 3 | experiment | 01 |
| 4 | crop | SB |
| folder | experiments | |
|---|---|---|
| 39 | Soybean | 36 |
| 27 | Peanut | 21 |
| 26 | Maize | 12 |
| 37 | Sequence | 11 |
| 25 | Lentil | 10 |
| 49 | Tomato | 10 |
| 31 | Potato | 10 |
| 44 | Sunflower | 9 |
| 2 | Bahia | 9 |
| 7 | Brachiaria | 9 |
| 42 | Sugarbeet | 8 |
| 43 | Sugarcane | 8 |
| 36 | Seasonal | 8 |
| 48 | Teff | 7 |
| 33 | Rice | 7 |
WindowsPath('C:/Users/benny/OneDrive/Documents/Github/xdssat/docs/learn/data/module2/naming.csv')4. Species, ecotype and cultivar coefficients
CROPGRO reads its crop parameters at three levels:
- species (
SBGRO048.SPE): what all soybeans share, such as cardinal temperatures and photosynthesis and respiration parameters; - ecotype (
SBGRO048.ECO): groups of cultivars, here by maturity group; - cultivar (
SBGRO048.CUL): the coefficients users estimate for each variety.
Soybean is a short-day plant. Its development toward flowering slows when days are longer than a critical day length CSDL; PPSEN is the slope of that slowing per hour. The engine computes the relative rate with an “inverse linear” curve (UTILS.for:378-383), called in PHENOL.for:243 with the day length at which the rate reaches its minimum THVAR set to CSDL + (1 - THVAR) / PPSEN (Ipphenol.for:239-240).
| var | name | ECO# | CSDL | PPSEN | THVAR | EM-FL | FL-SD | SD-PM | WTPSD | SFDUR | |
|---|---|---|---|---|---|---|---|---|---|---|---|
| 0 | 990011 | M GROUP 000 | SB0001 | 14.60 | 0.129 | 0.0 | 15.5 | 12.0 | 29.5 | 0.19 | 23.0 |
| 1 | 990012 | M GROUP 00 | SB0001 | 14.35 | 0.148 | 0.0 | 16.0 | 12.0 | 30.0 | 0.19 | 23.0 |
| 2 | 990013 | M GROUP 0 | SB0001 | 14.10 | 0.171 | 0.0 | 16.8 | 13.0 | 30.8 | 0.19 | 23.0 |
| 3 | 990001 | M GROUP 1 | SB0101 | 13.84 | 0.203 | 0.0 | 17.0 | 13.0 | 31.6 | 0.19 | 23.0 |
| 4 | 990002 | M GROUP 2 | SB0201 | 13.59 | 0.249 | 0.0 | 17.4 | 13.5 | 32.4 | 0.19 | 23.0 |
| 5 | 990003 | M GROUP 3 | SB0301 | 13.40 | 0.285 | 0.0 | 19.0 | 14.0 | 33.2 | 0.19 | 23.0 |
| 6 | 990004 | M GROUP 4 | SB0401 | 13.09 | 0.294 | 0.0 | 19.4 | 15.0 | 34.0 | 0.19 | 23.0 |
| 7 | 990005 | M GROUP 5 | SB0501 | 12.83 | 0.303 | 0.0 | 19.8 | 15.5 | 34.8 | 0.18 | 23.0 |
| 8 | 990006 | M GROUP 6 | SB0601 | 12.58 | 0.311 | 0.0 | 20.2 | 16.0 | 35.6 | 0.18 | 23.0 |
| 9 | 990007 | M GROUP 7 | SB0701 | 12.33 | 0.320 | 0.0 | 20.8 | 16.0 | 36.4 | 0.18 | 23.0 |
| 10 | 990008 | M GROUP 8 | SB0801 | 12.07 | 0.330 | 0.0 | 21.5 | 16.0 | 37.2 | 0.18 | 23.0 |
| 11 | 990009 | M GROUP 9 | SB0901 | 11.88 | 0.340 | 0.0 | 23.0 | 16.0 | 37.4 | 0.18 | 23.0 |
| 12 | 990010 | M GROUP 10 | SB1001 | 11.78 | 0.349 | 0.0 | 23.5 | 16.0 | 37.4 | 0.18 | 23.0 |
| 13 | IB0001 | BRAGG | SB0701 | 12.33 | 0.320 | 0.0 | 19.5 | 15.2 | 37.6 | 0.17 | 24.0 |
model_name
CERES-Maize                                     P1 P2 P5 G2 G3 PHINT
CERES-Millet                         P1 P2O P2R P5 G1 G4 PHINT GT G5
CERES-Rice         P1 P2R P5 P2O G1 G2 G3 PHINT THOT TCLDP TCLDF ...
CERES-Sorghum      P1 P2 P2O P2R PANTH P3 P4 P5 PHINT G1 G2 PBASE...
CERES-Wheat                                P1V P1D P5 G1 G2 G3 PHINT
CROPGRO-Peanut     CSDL PPSEN EM-FL FL-SH FL-SD SD-PM FL-LF LFMAX...
CROPGRO-Soybean    CSDL PPSEN EM-FL FL-SH FL-SD SD-PM FL-LF LFMAX...
Name: coefficient, dtype: str
The course exercise: maturity groups 3, 5 and 7
The irrigated treatment of UFGA7901 with the generic maturity group 3, 5 and 7 cultivars of the cultivar file, water and nitrogen simulated as in the experiment. The self test asks for the days to flowering and to physiological maturity, the time between them, and the seed yield.
| var | maturity_group | R1_dap | maturity_dap | HWAM | seed_number | seed_mg | R1_to_maturity | |
|---|---|---|---|---|---|---|---|---|
| 0 | 990003 | 3 | 28 | 81 | 2392.0 | 1739.0 | 137.548104 | 53 |
| 1 | 990005 | 5 | 35 | 97 | 2912.0 | 2132.0 | 136.585623 | 62 |
| 2 | 990007 | 7 | 45 | 116 | 3114.0 | 1891.0 | 164.668918 | 71 |
Maturity group and planting date
Four cultivars (generic maturity groups 3, 5 and 7, and Bragg) planted every three weeks from April to August at Gainesville, all under potential production (water and N switched off), in one FileX:
| name | BRAGG | M GROUP 3 | M GROUP 5 | M GROUP 7 |
|---|---|---|---|---|
| pdate | ||||
| 1979-04-10 | 43 | 30 | 35 | 47 |
| 1979-05-01 | 50 | 32 | 40 | 53 |
| 1979-05-22 | 50 | 31 | 40 | 53 |
| 1979-06-12 | 46 | 30 | 37 | 48 |
| 1979-07-03 | 39 | 26 | 32 | 41 |
| 1979-07-24 | 33 | 25 | 29 | 35 |
| 1979-08-14 | 28 | 25 | 26 | 29 |
One coefficient at a time: the course’s values
Exercise 3 of the course: start from the generic maturity group 7 cultivar (990007) and change one coefficient at a time, to the values the course gives, in the irrigated treatment. Every value is a separate cultivar in a copy of the cultivar file (learnlib.write_cultivar_variants), so the sweep is one FileX and one engine call. The last entry is exercise 4, a new cultivar: maturity group 7 with PODUR = 7.
['990007 M GROUP   7          . SB0701 12.33 0.320  20.8  10.0  16.0 36.40 18.00 1.030  375. 180.0  1.00  0.18  23.0  2.05  10.0  78.0  .400  .200', 'DS0001 DSSAT Workshop c     . SB0701 12.33 0.320  20.8  10.0  16.0 36.40 18.00 1.030  375. 180.0  1.00  0.18  23.0  2.05   7.0  78.0  .400  .200']
19 runs in one engine call, 4.7 s| coefficient | value | label | R1_dap | maturity_dap | HWAM | seed_number | seed_mg | HIAM | LAIX | |
|---|---|---|---|---|---|---|---|---|---|---|
| 0 | standard MG 7 | NaN | standard MG 7 | 45 | 116 | 3114.0 | 1891.0 | 164.668918 | 0.476596 | 6.074248 |
| 1 | EM-FL | 16.00 | EM-FL = 16 | 37 | 111 | 3269.0 | 1914.0 | 170.817792 | 0.528958 | 5.193697 |
| 2 | EM-FL | 20.00 | EM-FL = 20 | 44 | 115 | 3144.0 | 1900.0 | 165.480658 | 0.484492 | 5.946327 |
| 3 | EM-FL | 24.00 | EM-FL = 24 | 51 | 119 | 3038.0 | 1791.0 | 169.581532 | 0.452891 | 6.415170 |
| 4 | SFDUR | 13.00 | SFDUR = 13 | 45 | 116 | 2140.0 | 1247.0 | 171.565890 | 0.320216 | 6.078144 |
| 5 | SFDUR | 18.00 | SFDUR = 18 | 45 | 116 | 2695.0 | 1586.0 | 169.945255 | 0.415954 | 6.076196 |
| 6 | SFDUR | 23.00 | SFDUR = 23 | 45 | 116 | 3114.0 | 1891.0 | 164.668918 | 0.476596 | 6.074248 |
| 7 | SFDUR | 28.00 | SFDUR = 28 | 45 | 116 | 3334.0 | 2213.0 | 150.641099 | 0.513142 | 6.072300 |
| 8 | PODUR | 7.00 | PODUR = 7 | 45 | 116 | 3117.0 | 1935.0 | 161.053136 | 0.483288 | 6.070409 |
| 9 | PODUR | 10.00 | PODUR = 10 | 45 | 116 | 3114.0 | 1891.0 | 164.668918 | 0.476596 | 6.074248 |
| 10 | PODUR | 13.00 | PODUR = 13 | 45 | 116 | 3173.0 | 1805.0 | 175.823689 | 0.478480 | 6.076315 |
| 11 | PODUR | 16.00 | PODUR = 16 | 45 | 116 | 3102.0 | 1887.0 | 164.450496 | 0.464380 | 6.077608 |
| 12 | WTPSD | 0.14 | WTPSD = 0.14 | 45 | 116 | 3111.0 | 2421.0 | 128.515810 | 0.479143 | 6.039122 |
| 13 | WTPSD | 0.18 | WTPSD = 0.18 | 45 | 116 | 3114.0 | 1891.0 | 164.668918 | 0.476596 | 6.074248 |
| 14 | WTPSD | 0.22 | WTPSD = 0.22 | 45 | 116 | 3119.0 | 1552.0 | 200.969517 | 0.478784 | 6.098143 |
| 15 | WTPSD | 0.26 | WTPSD = 0.26 | 45 | 116 | 3122.0 | 1315.0 | 237.379938 | 0.477504 | 6.123646 |
| 16 | CSDL | 12.07 | CSDL = 12.07 | 51 | 124 | 3011.0 | 1849.0 | 162.882507 | 0.436804 | 6.603124 |
| 17 | PPSEN | 0.33 | PPSEN = 0.33 | 46 | 117 | 3115.0 | 1860.0 | 167.460799 | 0.471649 | 6.168492 |
| 18 | new cultivar | 7.00 | DS0001: MG 7 with PODUR 7 | 45 | 116 | 3117.0 | 1935.0 | 161.053136 | 0.483288 | 6.070409 |
WindowsPath('C:/Users/benny/OneDrive/Documents/Github/xdssat/docs/learn/data/module2/mg7_base.csv')5. Things to try
- Run the rainfed treatment with
PHOTO=C: does the difference between the two photosynthesis methods grow or shrink under water stress? - Add a scenario with radiation x 1.2 and temperature +2 °C. Is the combined change the sum of the two?
- Plant maturity group 7 in late July. Why does it flower so much sooner after planting than in April?
- Which of the six coefficients change seed yield without changing the date of first flower?
- Exercise 3g asks for CSDL and PPSEN together, as a full move from maturity group 7 to 8. Add that variant.
| 0 | |
|---|---|
| engine | C:\TEMP\dsn\dssat\dscsm048.exe |
| model | CRGRO048 |
| csm_data_commit | 99c95b340acb9515c2d0a8ab582f5fbbf076f345 |
| csm_os_commit | 25c93b9a2f73f8ec45bf441b198dac5fb7b22849 |
| run_on | 2026-11-07 07:42 |