import {withDownload, adminMarks, cellFeatures, fmt} from "../assets/js/dl.js"
summary = FileAttachment("data/summary.json").json()
cells = FileAttachment("data/grid_cells.csv").csv({typed: true})
districtsGeo = FileAttachment("data/districts.geojson").json()
outline = FileAttachment("data/java_outline.geojson").json()
provinces = FileAttachment("data/provinces.geojson").json()
districts = FileAttachment("data/districts.csv").csv({typed: true})
irrClasses = FileAttachment("data/java_irrigation_classes.csv").csv({typed: true})
obsProv = FileAttachment("data/obs_province_years.csv").csv({typed: true})
obsMeans = FileAttachment("data/obs_district_means.csv").csv({typed: true})
flagsJava = FileAttachment("data/obs_flags_java.csv").csv({typed: true})
flagsAll = FileAttachment("data/obs_flags_all.csv").csv({typed: true})
cultivars = FileAttachment("data/cultivars.csv").csv()
sens = FileAttachment("data/sensitivity.csv").csv({typed: true})
cur = summary.current
mapW = Math.min(width, 960)Datasets, area of interest and variety
What goes into a Java run, at what resolution, and what each dataset is used for
The datasets
| Dataset | Provider and reference | Native format | Used for |
|---|---|---|---|
| AgERA5 daily agrometeorological indicators | Copernicus Climate Change Service (Copernicus Climate Change Service 2019) | netCDF, 0.1°, daily, global; one file per variable and year | Weather of every cell: SRAD, TMAX, TMIN, RAIN, DEWP, WIND (src/agera5.py) |
| SoilGrids 2.0 | ISRIC (Poggio et al. 2021) | GeoTIFF/VRT, 250 m, Interrupted Goode Homolosine, six depths, mean layers |
Texture, organic carbon, bulk density, pH, CEC, N: one soil profile per cell (src/soils.py) |
WISE profiles in DSSAT’s WI.SOL |
Romero et al. (2012) | DSSAT .SOL text |
Scaling SoilGrids organic carbon; checking the root-growth rule |
| Rice fields (luas baku sawah) 2024 | ATR/BPN | GeoPackage, 1,430,241 polygons, 7,384,340 ha | Where rice is, as a share of each 100 m pixel (src/rasters.py) |
| Java rice by irrigation type | Ministry of Agriculture (MoA) | Two shapefiles (irrigated, rain-fed), attributes *_09 |
Water regime: classes 1-3 irrigated, 4 rain-fed |
| Agro-ecological zones | BBSDLP | Shapefile, island groups (KML_FOLDER) and 57 zones (SIMBOL) |
Selecting Java; zone calendars in by_zone mode |
| Soil map 1:50,000 | BBSDLP | Shapefile, class names only (JNTNH1-3) |
Rasterised for reference; no physical properties |
| Province (admin1) and district (admin2) boundaries | BPS codes (a1bps, a2bps), files idn_bnd_adm1.shp, idn_bnd_adm2.shp |
Shapefile | Rice area per district; province and district lines on every map |
| District rice statistics | MoA BDSP portal, source named there: BPS (Kementerian Pertanian Republik Indonesia 2026) | HTML tables, scraped | Observed harvested area, production and yield, 1986-2025 |
| Rice experiment IRMZ8601 | IRRI, Munoz 1986, in dssat-csm-data (BSD-3) |
DSSAT FileX .RIX |
Template management: transplanting, flood, split N |
Counts and file details: the module docstrings of src/agera5.py, src/soils.py, src/rasters.py; scripts/prepare_rasters.py lists the input paths. The provenance of the boundary files beyond their BPS codes is not documented in this repository. On every map, province lines (bold) and district lines (thin) are cut to the Java area of interest plus 1° and simplified by 0.002° by export_data.py, for location only.
The area of interest: Java
Java is selected by the island group “Jawa” of the agro-ecological zone map, burned onto the same 100 m grid as the rice fields. Every 100 m pixel with rice belongs to exactly one 0.1° AgERA5 cell (the cell that holds its centre), so the cell totals add up to the raster total. For the current run that is ha of rice in cells.
Rice ha per province: sum over the districts that scripts/compare_districts.py compares (at least 1,000 ha of rice and 5 observed years), from idn_adm2_filled.tif, so a few small districts are missing from the total.
Rice fields at 100 m
The rasters behind the cells are too large for the browser, so here they are as static images (500 m blocks; the model uses the 100 m pixels). The grid is ESRI:54034 (World Cylindrical Equal Area), on which every pixel is 1 ha. Polygons are burned with all_touched, so no field is lost however small, and the share of each pixel under rice comes from a 20 m sub-grid.
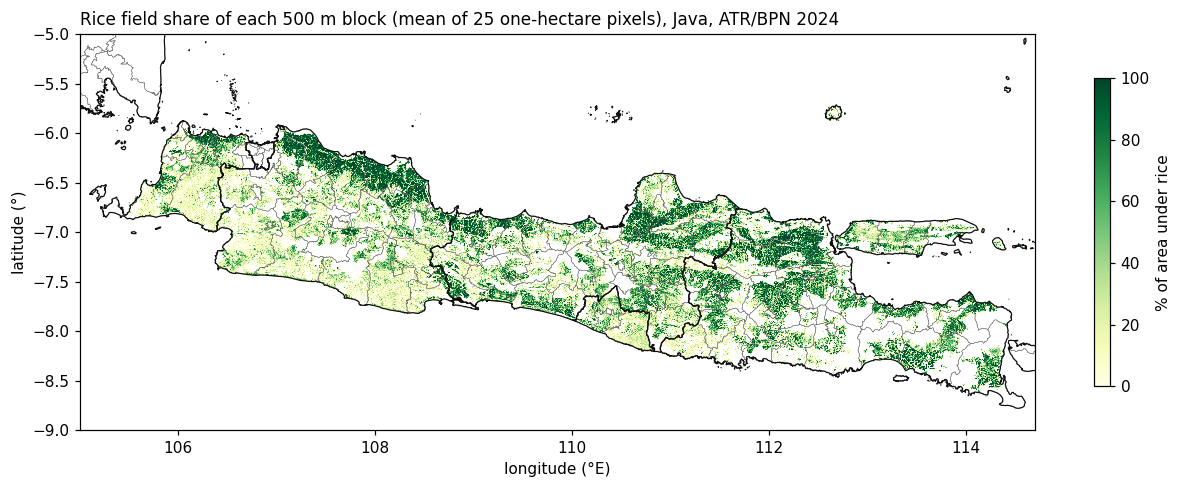
idn_rice.tif, 100 m).
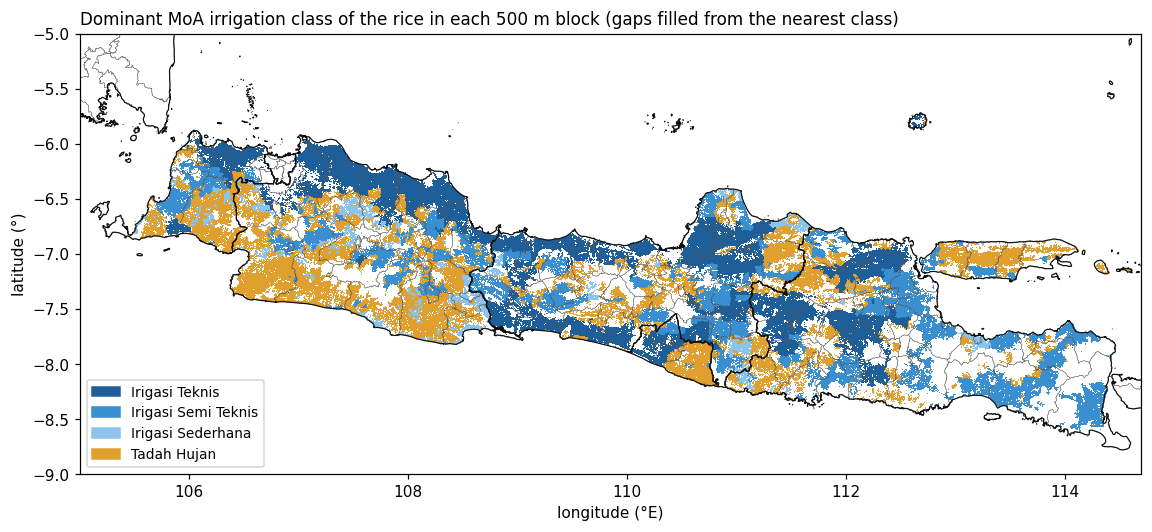
The MoA maps do not cover every ATR/BPN rice field. Pixels without a class take the class of the nearest MoA pixel; the chart shows how much rice area that concerns.
Computed by export_data.py from idn_rice.tif and idn_irrigation_filled.tif (band 2 = distance to the MoA pixel the class came from; 0 = own class), restricted to the island group Jawa. Water regime in the model: classes 1-3 irrigated, 4 (tadah hujan) rain-fed.
Agro-ecological zones
Each stratum carries the dominant agro-ecological zone (BBSDLP SIMBOL) of its cell’s rice. The by_zone mode gives each zone one planting calendar.
Weather: AgERA5
AgERA5 is a daily, 0.1° product derived from the ERA5 reanalysis for agricultural use (Copernicus Climate Change Service 2019). xdssat extracts the Indonesia box once into a cache in DSSAT units (int16 with a scale factor of 0.1, the precision the weather file carries). Days run from midnight to midnight local time, per the source’s long_name. The map shows the seasonal means the engine itself reports for each simulated season (TMINA, TMAXA, SRADA, PRCP in summary.csv), averaged over 30 years.
Soil: SoilGrids 2.0 to DSSAT profiles
Each weather cell gets one soil profile: the rice-area-weighted mean of the SoilGrids properties over the 100 m rice pixels in the cell, at six depths, converted to DSSAT layer values (method on the Scientific method page). The map shows the top layer (0-5 cm) of the profile that enters the engine, read back from java.SOL.
Observed yields: BDSP district statistics
Harvested area, production and yield per district and year come from the Ministry of Agriculture’s BDSP portal, which names BPS as the source (Kementerian Pertanian Republik Indonesia 2026). scripts/fetch_bdsp.py downloads the tables (raw pages kept) and scripts/clean_bdsp.py cleans them, recording every change with its raw value. For Java the cleaned tables hold districts and district-years with a yield, .
Province yield = sum of production / sum of harvested area over the districts that report both, times 10 (t/ha to ku/ha). Gaps are years in which no district of the province reports both values after cleaning.
The cleaning rules and the number of values each one changed (all Indonesia, and Java by province):
Variety: IR 58 and IR 64
The template experiment is IRRI’s IRMZ8601, a transplanted IR 58 trial (cultivar IB0012), which stays the default. IR 64 (IB0015) is the second cultivar in the template. The coefficients are read from the engine’s own cultivar file ():
How far do cultivar and nitrogen move the simulated yield? A 40-cell sample (spikes/n_cultivar_sensitivity.py) ran every cultivar and nitrogen rate of the template. After the initial soil nitrogen fix, the crop responds to fertiliser as it should; before it, it did not.
checks/n_cultivar_sensitivity.csv (before the correction of the initial soil nitrogen) and n_cultivar_sensitivity_soc1.csv (after): 40 cells, season years 1992-2014, SLPF 1, per_cell calendar; area-weighted by stratum rice ha. IR 64 has a longer season and is higher at every N rate; neither cultivar nor N alone brings the model down to the observed level, which is why the level is calibrated with SLPF.
References
Copernicus Climate Change Service. 2019. Agrometeorological Indicators from 1979 up to 2019 Derived from Reanalysis (AgERA5). ECMWF. https://doi.org/10.24381/cds.6c68c9bb.
Kementerian Pertanian Republik Indonesia. 2026. Basis Data Statistik Pertanian (BDSP): Lokasi, Padi, Luas Panen, Produksi, Produktivitas. https://bdsp2.pertanian.go.id/bdsp/id/lokasi.
Poggio, Laura, Luis M. de Sousa, Niels H. Batjes, et al. 2021. “SoilGrids 2.0: Producing Soil Information for the Globe with Quantified Spatial Uncertainty.” SOIL 7 (1): 217–40. https://doi.org/10.5194/soil-7-217-2021.
Romero, Consuelo C., Gerrit Hoogenboom, Guillermo A. Baigorria, Jawoo Koo, Arjan J. Gijsman, and Stanley Wood. 2012. “Reanalysis of a Global Soil Database for Crop and Environmental Modeling.” Environmental Modelling & Software 35: 163–70. https://doi.org/10.1016/j.envsoft.2012.02.018.