engine      : C:\TEMP\dsn\dssat\dscsm048.exe
work root   : C:\TEMP\dsn\work
csm-data    : C:\Users\benny\OneDrive\Documents\Github\dssat-csm-data @ 99c95b34
experiment : https://github.com/DSSAT/dssat-csm-data/blob/99c95b340acb9515c2d0a8ab582f5fbbf076f345/Maize/UFGA8201.MZXModule 1: running a crop model, phenology, sensitivity and potential production
This notebook follows the first day of a DSSAT training course: run an existing experiment, look at how the crop model times development, change one input at a time, and build a “potential production” experiment in which only weather, CO2 and the cultivar limit the crop.
Everything the DSSAT shell does through windows (XBuild, the Sensitivity Analysis tool, GBuild) is done here in Python, with xdssat’s modules (src/filex.py, src/runner.py, src/genotype.py), and the stock DSSAT engine dscsm048 (DSSAT-CSM 4.8).
Data. The maize experiment UFGA8201 (Gainesville, Florida, 1982; McCurdy 84aa; three water x two nitrogen treatments) and its weather and soil come from DSSAT/dssat-csm-data (BSD-3), pinned to one commit below.
Needs. The DSSAT engine (XDSSAT_ENGINE), a short work folder outside OneDrive (XDSSAT_WORK), and dssat-csm-data cloned next to this repository. See docs/xdssat/getting-started.md. The cells write only to the work folder and, at the end of each part, small CSV files in docs/learn/data/module1/ that the website reads.
0. What is inside DSSAT’s Cropping System Model
DSSAT’s Cropping System Model (CSM) is one Fortran program built from modules: one for the weather, one for the soil (water, nitrogen, carbon, temperature), one for the soil-plant-atmosphere exchange (SPAM), one for management, and a family of plant models plugged into the same interface (Jones et al. 2003). Counting the source code of the engine used here (dssat-csm-os at the pinned commit) shows how the work is divided:
| module | source_files | lines | |
|---|---|---|---|
| 0 | Plant | 361 | 214677 |
| 1 | Soil | 78 | 32636 |
| 2 | SPAM | 14 | 9092 |
| 3 | Weather | 9 | 5801 |
| 4 | Management | 13 | 6249 |
| 5 | InputModule | 40 | 20345 |
| 6 | Utilities | 21 | 22920 |
| 7 | CSM_Main | 2 | 1233 |
| TB | TO1 | TO2 | TM | phase | |
|---|---|---|---|---|---|
| 0 | 7.0 | 28.0 | 35.0 | 45.0 | VEGETATIVE DEVELOPMENT |
| 1 | 6.0 | 26.0 | 30.0 | 45.0 | EARLY REPRODUCTIVE DEVELOPMENT |
| 2 | -15.0 | 26.0 | 34.0 | 45.0 | LATE REPRODUCTIVE DEVELOPMENT |
| plant_model | source_files | |
|---|---|---|
| 0 | ALOHA-Pineapple | 9 |
| 1 | AROIDS | 13 |
| 2 | CANEGRO-Sugarcane | 17 |
| 3 | CASUPRO-Sugarcane | 20 |
| 4 | CERES-IXIM-Maize | 9 |
| 5 | CERES-Maize | 10 |
| 6 | CERES-Millet | 10 |
| 7 | CERES-Rice | 15 |
| 8 | CERES-SharedFiles | 2 |
| 9 | CERES-Sorghum | 8 |
| 10 | CERES-Sugarbeet | 9 |
| 11 | CERES-SweetCorn | 2 |
| 12 | CERES-TEFF | 13 |
| 13 | CERES-Wheat_Barley | 8 |
| 14 | CROPGRO | 27 |
| 15 | CROPSIM | 9 |
| 16 | CSCAS | 2 |
| 17 | CSYCA-Cassava | 53 |
| 18 | FORAGE | 41 |
| 19 | Generic-Pest | 11 |
| 20 | Generic-PlantP | 9 |
| 21 | NTEF | 13 |
| 22 | NWHEAT | 14 |
| 23 | OilCrop-Sunflower | 10 |
| 24 | SAMUCA-Sugarcane | 16 |
| 25 | SUBSTOR-Potato | 10 |
1. Running a crop model
A DSSAT experiment file (FileX, here UFGA8201.MZX) lists factor levels (cultivars, fields, initial conditions, planting, irrigation, fertilizer, simulation controls …) and treatments, each a combination of one level per factor. The table below is the FileX’s own treatment section.
| N | TNAME | CU | FL | IC | MP | MI | MF | SM | |
|---|---|---|---|---|---|---|---|---|---|
| 0 | 1 | RAINFED LOW NITROGEN | 1 | 1 | 1 | 1 | 1 | 1 | 1 |
| 1 | 2 | RAINFED HIGH NITROGEN | 1 | 1 | 1 | 1 | 1 | 2 | 1 |
| 2 | 3 | IRRIGATED LOW NITROGEN | 1 | 1 | 1 | 1 | 2 | 1 | 1 |
| 3 | 4 | IRRIGATED HIGH NITROGEN | 1 | 1 | 1 | 1 | 2 | 2 | 1 |
| 4 | 5 | VEG STRESS LOW NITROGEN | 1 | 1 | 1 | 1 | 3 | 1 | 1 |
| 5 | 6 | VEG STRESS HIGH NITROGEN | 1 | 1 | 1 | 1 | 3 | 2 | 1 |
In the DSSAT shell you would select the six treatments and press Run. Here: copy the experiment, its observed data (FileA .MZA, FileT .MZT), the weather file and the soil file into a fresh work folder and call the engine on it. outputs="daily" asks for the daily CSV outputs (PlantGro, SoilWat, Weather …).
6 treatments in 1.7 s, model MZCER048| TRNO | TNAM | PDAT | ADAT | MDAT | HWAM | CWAM | LAIX | PRCM | IRCM | NUCM | |
|---|---|---|---|---|---|---|---|---|---|---|---|
| 0 | 1 | RAINFED LOW NITROGEN | 1982057 | 1982133 | 1982185 | 2293 | 6556 | 1.988984 | 661 | 13 | 98 |
| 1 | 2 | RAINFED HIGH NITROGEN | 1982057 | 1982133 | 1982185 | 2293 | 7538 | 3.273873 | 661 | 13 | 132 |
| 2 | 3 | IRRIGATED LOW NITROGEN | 1982057 | 1982133 | 1982185 | 8207 | 14578 | 2.507062 | 661 | 264 | 137 |
| 3 | 4 | IRRIGATED HIGH NITROGEN | 1982057 | 1982133 | 1982185 | 11854 | 22454 | 4.547936 | 661 | 264 | 249 |
| 4 | 5 | VEG STRESS LOW NITROGEN | 1982057 | 1982133 | 1982185 | 7718 | 13458 | 2.507062 | 661 | 201 | 132 |
| 5 | 6 | VEG STRESS HIGH NITROGEN | 1982057 | 1982133 | 1982185 | 10293 | 19234 | 4.030581 | 661 | 201 | 224 |
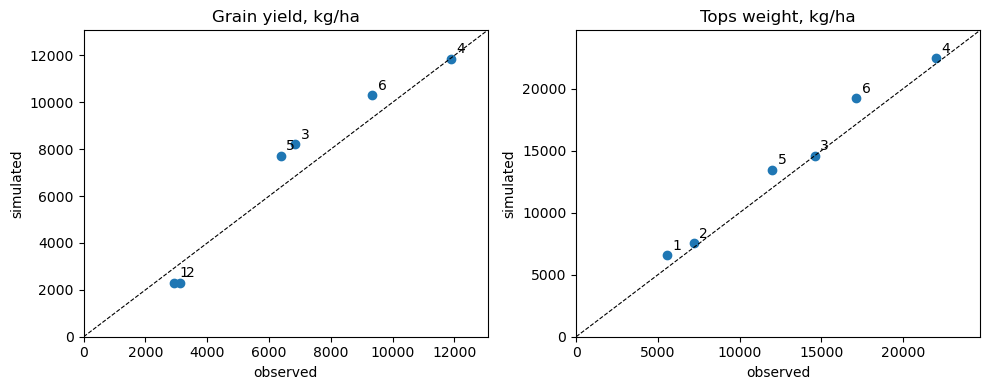
Simulated against observed
The FileA holds what was measured at the end of the season. Dates become days after planting (DAP) so they can be compared.
| observed | simulated | ||||||||||
|---|---|---|---|---|---|---|---|---|---|---|---|
| variable | Anthesis, DAP | Grain yield, kg/ha | LAI, maximum | Maturity, DAP | Tops weight, kg/ha | Anthesis, DAP | Grain yield, kg/ha | LAI, maximum | Maturity, DAP | Tops weight, kg/ha | |
| TRNO | treatment | ||||||||||
| 1 | Rainfed Low Nitrogen | 75.0 | 2929.0 | 2.26 | 128.0 | 5532.0 | 76.0 | 2293.0 | 1.99 | 128.0 | 6556.0 |
| 2 | Rainfed High Nitrogen | 75.0 | 3130.0 | 2.84 | 128.0 | 7201.0 | 76.0 | 2293.0 | 3.27 | 128.0 | 7538.0 |
| 3 | Irrigated Low Nitrogen | 75.0 | 6850.0 | 3.26 | 128.0 | 14581.0 | 76.0 | 8207.0 | 2.51 | 128.0 | 14578.0 |
| 4 | Irrigated High Nitrogen | 75.0 | 11881.0 | 4.09 | 128.0 | 22001.0 | 76.0 | 11854.0 | 4.55 | 128.0 | 22454.0 |
| 5 | Veg Stress Low Nitrogen | 75.0 | 6375.0 | 2.76 | 128.0 | 12002.0 | 76.0 | 7718.0 | 2.51 | 128.0 | 13458.0 |
| 6 | Veg Stress High Nitrogen | 75.0 | 9344.0 | 3.70 | 128.0 | 17146.0 | 76.0 | 10293.0 | 4.03 | 128.0 | 19234.0 |
Growth over the season
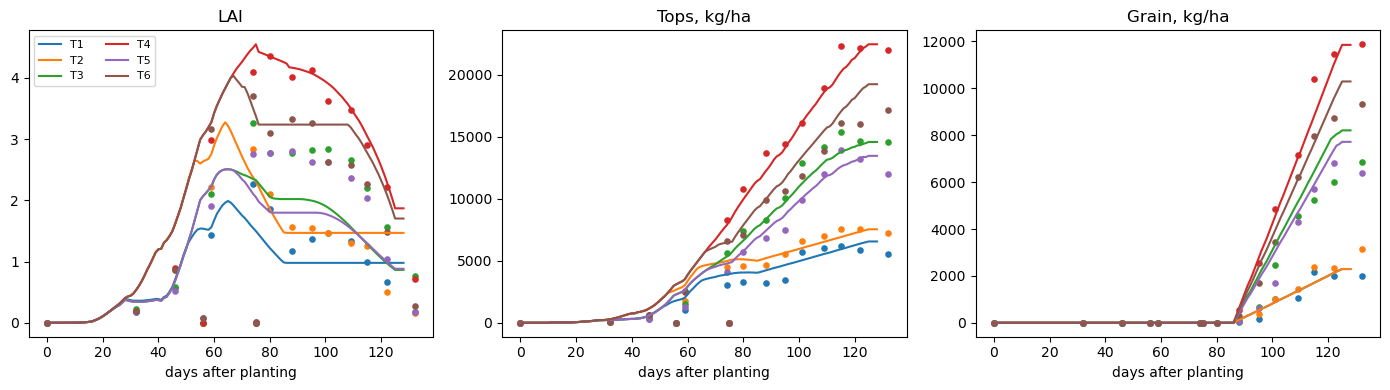
PlantGro holds the simulated crop every day; the FileT has the field samples. RMSE and Willmott’s index of agreement d (1 = perfect) summarise the fit per treatment, as the GBuild Statistics option does.
| rmse | d | |||||
|---|---|---|---|---|---|---|
| variable | CWAD | GWAD | LAID | CWAD | GWAD | LAID |
| TRNO | ||||||
| 1 | 1321.06 | 189.93 | 0.67 | 0.91 | 0.98 | 0.64 |
| 2 | 1610.28 | 201.51 | 1.02 | 0.91 | 0.98 | 0.66 |
| 3 | 1776.26 | 771.74 | 1.06 | 0.97 | 0.97 | 0.69 |
| 4 | 2466.43 | 451.09 | 1.49 | 0.97 | 1.00 | 0.79 |
| 5 | 1576.58 | 532.66 | 0.97 | 0.97 | 0.99 | 0.69 |
| 6 | 2202.13 | 337.84 | 1.26 | 0.97 | 1.00 | 0.77 |
WindowsPath('C:/Users/benny/OneDrive/Documents/Github/xdssat/docs/learn/data/module1/stats.csv')2. Phenology: thermal time
CERES-Maize counts development in thermal time (degree-days above a base temperature). Each phase ends when its thermal-time requirement is met: P1 (emergence to end of the juvenile phase, a cultivar coefficient), a photoperiod-sensitive induction phase (P2), then silking, grain filling (P5) and maturity.
The daily thermal time DTT is computed in Plant/CERES-Maize/MZ_PHENOL.for, lines 437-517:
TMAX < TBASE: no development (DTT = 0);TMIN > DOPT: the maximum,DOPT - TBASE;- while the crop has 10 leaves or fewer, the growing point is near the soil surface and a soil-temperature estimate replaces air temperature (not reproduced below);
- if
TMIN < TBASEorTMAX > DOPT: 24 hourly temperatures from a sine curve, each clipped to[TBASE, DOPT], averaged; - otherwise the daily mean minus
TBASE.
TBASE, TOPT (= DOPT before anthesis) and ROPT (after) are read from the ecotype file. The code below reads them from the engine’s own MZCER048.ECO and the cultivar’s coefficients from MZCER048.CUL.
ecotype IB0001: {'TBASE': 8.0, 'TOPT': 34.0, 'ROPT': 34.0, 'P20': 12.5, 'DJTI': 4.0, 'GDDE': 6.0}
McCurdy 84aa : {'P1': 259.0, 'P2': 1.193, 'P5': 947.1, 'G2': 924.3, 'G3': 8.168, 'PHINT': 43.0}| date | TMAX | TMIN | DTT_air | GDD_cum | |
|---|---|---|---|---|---|
| 51 | 1982-02-21 | 24.4 | 9.4 | 8.900000 | 0.00000 |
| 52 | 1982-02-22 | 21.1 | 7.8 | 6.457897 | 0.00000 |
| 53 | 1982-02-23 | 23.9 | 1.1 | 6.174711 | 0.00000 |
| 54 | 1982-02-24 | 26.7 | 3.3 | 7.921077 | 0.00000 |
| 55 | 1982-02-25 | 27.2 | 10.6 | 10.900000 | 0.00000 |
| 56 | 1982-02-26 | 26.7 | 11.1 | 10.900000 | 10.90000 |
| 57 | 1982-02-27 | 25.6 | 8.9 | 9.250000 | 20.15000 |
| 58 | 1982-02-28 | 24.4 | 15.6 | 12.000000 | 32.15000 |
| 59 | 1982-03-01 | 17.8 | 8.3 | 5.050000 | 37.20000 |
| 60 | 1982-03-02 | 22.8 | 1.7 | 5.767770 | 42.96777 |
| stage | date | DAP | GDD_cum | |
|---|---|---|---|---|
| 0 | 0 | 1982-02-26 | 0 | 10.900000 |
| 1 | 1 | 1982-03-09 | 11 | 108.441091 |
| 2 | 2 | 1982-03-27 | 29 | 352.774424 |
| 3 | 3 | 1982-04-01 | 34 | 402.524424 |
| 4 | 4 | 1982-05-13 | 76 | 954.099323 |
| 5 | 5 | 1982-05-24 | 87 | 1133.449323 |
WindowsPath('C:/Users/benny/OneDrive/Documents/Github/xdssat/docs/learn/data/module1/coefficients.csv')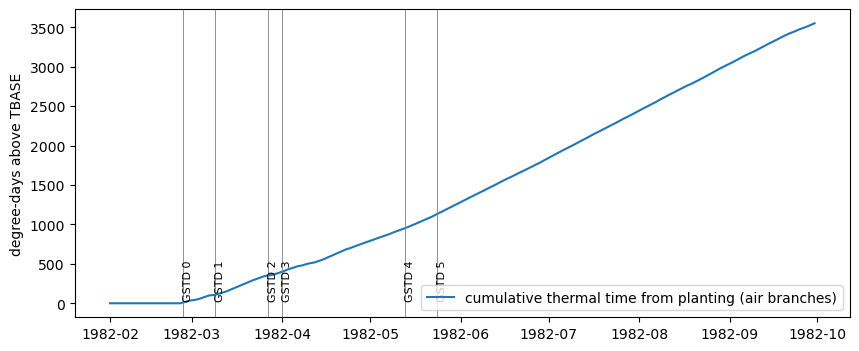
3. Potential production
The simplest experiment a crop model can run: water and nitrogen are not simulated (switches WATER and NITRO set to N in the simulation controls), so nothing but weather, CO2 and the cultivar limit growth. In DSSAT’s shell this is the “UFGA8211” file built in XBuild. Here it is built in code from treatment 4 of UFGA8201 with filex.build_filex; the planting date, the cultivar and the field are the same. The one-letter switches are written by learnlib.set_switches where the engine reads them: each is the last character of a 6-character field (InputModule/IPSIM.for:1001, FORMAT (I3,11X,9(5X,A1))).
When the water balance is off, DSSAT does not compute soil water at all (SPAM/SPAM.for:269), and with the N switch off, CERES-Maize has no N stress (MZ_GROSUB.for:2059).
Two CO2 options are compared: M, the measured Mauna Loa series (UFGA8201’s own setting), and D, the static default CO2BAS of 380 ppm in StandardData/CO2048.WDA (Weather/CO2VAL.for:5-7).
@N GENERAL     NYERS NREPS START SDATE RSEED SNAME.................... SMODEL
 1 GE              1     1     S 82056  2150 N X IRRIGATION, GAINESVI
@N OPTIONS     WATER NITRO SYMBI PHOSP POTAS DISES  CHEM  TILL   CO2
 1 OP              N     N     N     N     N     N     N     Y     D
@N METHODS     WTHER INCON LIGHT EVAPO INFIL PHOTO HYDRO NSWIT MESOM MESEV MESOL
 1 ME              M     M     E     R     S     R     R     1     G     R     2
@N MANAGEMENT  PLANT IRRIG FERTI RESID HARVS
 1 MA              R     R     R     N     M
@N OUTPUTS FNAME OVVEW SUMRY FROPT GROUT CAOUT WAOUT NIOU| scenario | CO2_mean | ADAT | MDAT | HWAM | CWAM | LAIX | |
|---|---|---|---|---|---|---|---|
| 0 | Potential, CO2 M | 340.887305 | 1982133 | 1982185 | 11859 | 23174 | 4.562119 |
| 0 | Potential, CO2 D | 380.000000 | 1982133 | 1982185 | 11983 | 23367 | 4.569410 |
| scenario | group | HWAM | CWAM | LAIX | CO2_mean | HWAM_obs | share_of_potential | |
|---|---|---|---|---|---|---|---|---|
| 0 | Potential, CO2 M | potential | 11859 | 23174 | 4.56 | 340.89 | NaN | 1.00 |
| 1 | Potential, CO2 D | potential | 11983 | 23367 | 4.57 | 380.00 | NaN | 1.01 |
| 2 | T1 Rainfed Low Nitrogen | UFGA8201 treatments | 2293 | 6556 | 1.99 | NaN | 2929.0 | 0.19 |
| 3 | T2 Rainfed High Nitrogen | UFGA8201 treatments | 2293 | 7538 | 3.27 | NaN | 3130.0 | 0.19 |
| 4 | T3 Irrigated Low Nitrogen | UFGA8201 treatments | 8207 | 14578 | 2.51 | NaN | 6850.0 | 0.69 |
| 5 | T4 Irrigated High Nitrogen | UFGA8201 treatments | 11854 | 22454 | 4.55 | NaN | 11881.0 | 1.00 |
| 6 | T5 Veg Stress Low Nitrogen | UFGA8201 treatments | 7718 | 13458 | 2.51 | NaN | 6375.0 | 0.65 |
| 7 | T6 Veg Stress High Nitrogen | UFGA8201 treatments | 10293 | 19234 | 4.03 | NaN | 9344.0 | 0.87 |
4. Sensitivity analysis
The Sensitivity Analysis tool changes one input and reruns. Under potential production (so water and N do not blur the picture) we change, one at a time:
- the cultivar: six maize cultivars of the engine’s
MZCER048.CUL, from short to long juvenile phase (P1), as extra treatments with a differentINGENO; - the planting date: 26 February plus 0 to 10 weeks in 2-week steps (every date of the template moves with planting);
- a genetic coefficient: P1 and P5 of McCurdy 84aa, through a per-run copy of the cultivar file (
genotype.write_cultivar_files), leaving the engine’s own file untouched.
| var | name | P1 | P2 | P5 | G2 | G3 | PHINT | |
|---|---|---|---|---|---|---|---|---|
| 9 | 990003 | SHORT SEASON | 110.0 | 0.300 | 680.0 | 820.4 | 6.600 | 38.9 |
| 2 | PC0001 | 2500-2600 GDD | 160.0 | 0.750 | 780.0 | 750.0 | 8.500 | 49.0 |
| 8 | 990002 | MEDIUM SEASON | 200.0 | 0.300 | 800.0 | 700.0 | 8.500 | 38.9 |
| 45 | IB0035 | McCurdy 84aa | 259.0 | 1.193 | 947.1 | 924.3 | 8.168 | 43.0 |
| 69 | IB0059 | H6 | 310.0 | 0.300 | 685.0 | 907.9 | 10.000 | 38.9 |
| 74 | IB0064 | H.OBREGON | 360.0 | 0.800 | 685.0 | 907.9 | 10.150 | 38.9 |
| var | name | P1 | P2 | P5 | G2 | G3 | anthesis_dap | maturity_dap | HWAM | CWAM | LAIX | |
|---|---|---|---|---|---|---|---|---|---|---|---|---|
| 0 | 990003 | SHORT SEASON | 110.0 | 0.300 | 680.0 | 820.4 | 6.600 | 58 | 101 | 5002 | 13052 | 2.667704 |
| 1 | PC0001 | 2500-2600 GDD | 160.0 | 0.750 | 780.0 | 750.0 | 8.500 | 68 | 113 | 7751 | 16710 | 2.715381 |
| 2 | 990002 | MEDIUM SEASON | 200.0 | 0.300 | 800.0 | 700.0 | 8.500 | 67 | 114 | 8676 | 19389 | 4.012970 |
| 3 | IB0035 | McCurdy 84aa | 259.0 | 1.193 | 947.1 | 924.3 | 8.168 | 76 | 128 | 11859 | 23174 | 4.562119 |
| 4 | IB0059 | H6 | 310.0 | 0.300 | 685.0 | 907.9 | 10.000 | 84 | 121 | 8615 | 22679 | 5.676199 |
| 5 | IB0064 | H.OBREGON | 360.0 | 0.800 | 685.0 | 907.9 | 10.150 | 87 | 124 | 8119 | 23035 | 5.881617 |
| planting | pdate | anthesis_dap | maturity_dap | HWAM | CWAM | LAIX | season_tmean | season_srad | |
|---|---|---|---|---|---|---|---|---|---|
| 0 | 26 Feb | 1982-02-26 | 76 | 128 | 11859 | 23174 | 4.562119 | 22.724031 | 18.560465 |
| 1 | 12 Mar | 1982-03-12 | 72 | 122 | 9254 | 20381 | 4.982561 | 23.662602 | 19.184553 |
| 2 | 26 Mar | 1982-03-26 | 70 | 120 | 12321 | 22919 | 4.802684 | 24.148760 | 19.363636 |
| 3 | 09 Apr | 1982-04-09 | 67 | 116 | 9958 | 21487 | 5.173677 | 25.103419 | 19.458120 |
| 4 | 23 Apr | 1982-04-23 | 65 | 114 | 11640 | 23595 | 5.229832 | 25.772174 | 19.427826 |
| 5 | 07 May | 1982-05-07 | 62 | 112 | 10217 | 22157 | 5.328450 | 26.480973 | 19.307080 |
| coefficient | value | anthesis_dap | maturity_dap | HWAM | CWAM | LAIX | |
|---|---|---|---|---|---|---|---|
| 0 | P1 | 150 | 63 | 119 | 11557 | 20126 | 2.885616 |
| 1 | P1 | 175 | 67 | 122 | 12477 | 22017 | 3.417914 |
| 2 | P1 | 200 | 68 | 123 | 12633 | 22178 | 3.566045 |
| 3 | P1 | 225 | 70 | 124 | 12848 | 22852 | 3.937589 |
| 4 | P1 | 250 | 74 | 127 | 12578 | 23315 | 4.305885 |
| 5 | P1 | 275 | 80 | 132 | 10929 | 23081 | 5.064129 |
| 6 | P1 | 300 | 84 | 134 | 10488 | 23517 | 5.394757 |
| 7 | P1 | 325 | 86 | 136 | 9335 | 22400 | 5.454202 |
| 8 | P1 | 350 | 89 | 139 | 9705 | 23879 | 5.683367 |
| 9 | P1 | 375 | 90 | 140 | 10064 | 24463 | 5.710293 |
| 10 | P5 | 700 | 76 | 115 | 7915 | 19180 | 4.562119 |
| 11 | P5 | 750 | 76 | 118 | 8836 | 20182 | 4.562119 |
| 12 | P5 | 800 | 76 | 121 | 9776 | 20945 | 4.562119 |
| 13 | P5 | 850 | 76 | 123 | 10403 | 21499 | 4.562119 |
| 14 | P5 | 900 | 76 | 126 | 11305 | 22558 | 4.562119 |
| 15 | P5 | 950 | 76 | 128 | 11859 | 23179 | 4.562119 |
| 16 | P5 | 1000 | 76 | 131 | 12371 | 23830 | 4.562119 |
| 17 | P5 | 1050 | 76 | 134 | 13219 | 24764 | 4.562119 |
| 18 | P5 | 1100 | 76 | 136 | 13846 | 25311 | 4.562119 |
WindowsPath('C:/Users/benny/OneDrive/Documents/Github/xdssat/docs/learn/data/module1/sens_coef_growth.csv')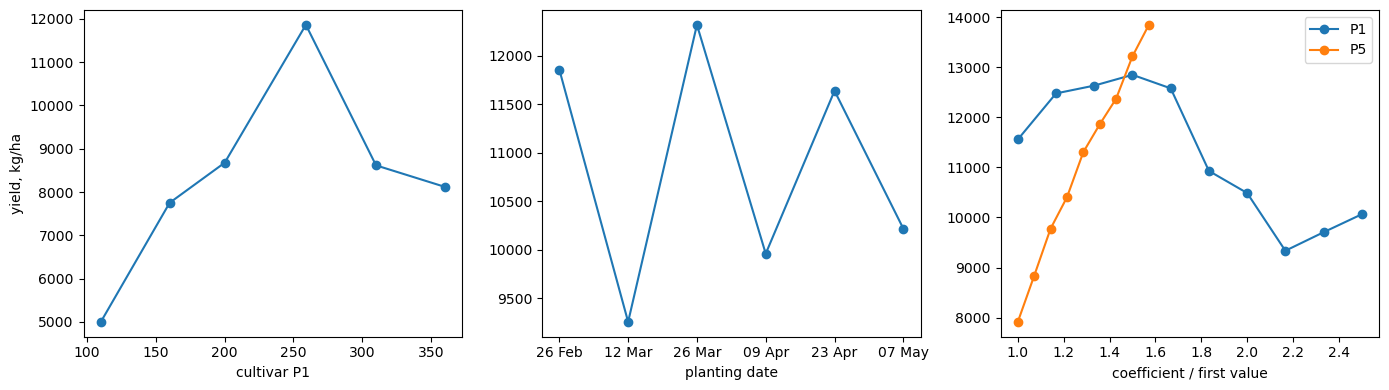
5. What the numbers say, and things to try
The page that goes with this notebook (learn/module1.qmd) reads the CSV files written above and shows them as interactive charts. Things to try in the notebook:
- Compare treatment 4 (irrigated, high N) with the potential run: how much of the potential did the field reach, and was water or nitrogen the larger limit (treatments 1-6)?
- Change
TEMPLATE_TRT, or add a planting date in July: what happens to anthesis, maturity and yield, and why (see the season temperature and radiation columns)? - Add G2 or G3 to the coefficient loop. Which coefficients move yield but not the dates?
| 0 | |
|---|---|
| engine | C:\TEMP\dsn\dssat\dscsm048.exe |
| model | MZCER048 |
| csm_data_commit | 99c95b340acb9515c2d0a8ab582f5fbbf076f345 |
| csm_os_commit | 25c93b9a2f73f8ec45bf441b198dac5fb7b22849 |
| run_on | 2026-11-07 07:41 |
References
Jones, J. W., G. Hoogenboom, C. H. Porter, et al. 2003. “The DSSAT Cropping System Model.” European Journal of Agronomy 18 (3–4): 235–65. https://doi.org/10.1016/S1161-0301(02)00107-7.