Sensitivity Analysis
The framework exposes three parameters that affect the corrected output but that are not formally optimised in the current release. This page documents how the headline diagnostics move when each parameter is varied around its default, using the Bali subdomain as the test bed. The result is a working characterisation of the parameter surface for users who want to tune the pipeline for their own region.
The three exposed parameters
Parameter (config.yml key) |
Default | Sweep range | What it controls |
|---|---|---|---|
deep_learning.blend_alpha (\(\alpha\)) |
0.70 | 0.50 to 0.90 | The LSEQM weight at full station-density confidence. Higher \(\alpha\) leans the output toward the LSEQM intermediate; lower \(\alpha\) lets the CNN refinement contribute more. The effective weight \(\alpha_{\mathrm{eff}} = 1 - C\,(1-\alpha)\) is then modulated by the station-density mask \(C\). See Blending. |
statistical_params.gpd_threshold_percentile |
80 | 70 to 90 | The wet-day percentile above which the Generalized Pareto tail is fitted. Lower percentiles give more exceedances per pixel (more stable fit) but conflate extreme rain with moderate rain that the Gamma EQM already captures; higher percentiles isolate the extreme regime but reduce the sample size at which the fit becomes noisy. See GPD Tail. |
station_density.saturation_count (\(c_{\mathrm{sat}}\)) |
2 | 1 to 5 | The number of (smoothed) stations per CPC 0.5 deg cell at which the confidence mask reaches 1.0. Lower \(c_{\mathrm{sat}}\) activates the CNN over more of the domain (less conservative); higher \(c_{\mathrm{sat}}\) restricts the CNN contribution to densely gauged regions (more conservative). See Confidence Mask. |
Sweep design
The sweep evaluates the pipeline on the Bali subdomain (\(9 \times 14\) grid at \(0.1^\circ\), \(80\) land pixels, all \(36\) dekadal windows of the \(2001\) to \(2025\) record). For each of the three parameters, five settings are run with the other two parameters held at their operating defaults (bold in the table above). That gives \(5 \times 3 = 15\) runs in total.
Metrics are pooled across the \(36\) dekads at the pixel level. The Pearson correlation is reported separately as the temporal-skill diagnostic; the remaining four metrics (relative bias, standard-deviation ratio, root-mean-square error, Nash-Sutcliffe efficiency) characterise the amplitude and distribution-alignment dimensions.
The runnable notebook for this sweep is at notebooks/sensitivity_sweep_bali.ipynb.
Results
Bali subdomain, pooled across \(36\) dekads, \(2001\) to \(2025\). Bold rows mark the operating defaults. r: Pearson correlation; RB: relative bias (%); SDR: standard-deviation ratio; RMSE: root-mean-square error (mm/day); NSE: Nash-Sutcliffe efficiency.
| Parameter | Value | \(r\) | RB (%) | SDR | RMSE | NSE |
|---|---|---|---|---|---|---|
| Blending weight \(\alpha\) | ||||||
| \(\alpha\) | 0.50 | 0.344 | \(-14.5\) | 0.910 | 5.88 | \(-0.40\) |
| 0.60 | 0.343 | \(-14.9\) | 0.907 | 5.89 | \(-0.40\) | |
| 0.70 | 0.340 | \(-15.0\) | 0.905 | 5.89 | \(-0.41\) | |
| 0.80 | 0.336 | \(-15.2\) | 0.903 | 5.90 | \(-0.41\) | |
| 0.90 | 0.332 | \(-15.5\) | 0.900 | 5.91 | \(-0.41\) | |
| GPD threshold percentile | ||||||
| Pctl | 70 | 0.345 | \(-13.0\) | 0.923 | 5.96 | \(-0.42\) |
| 75 | 0.342 | \(-13.7\) | 0.919 | 5.96 | \(-0.41\) | |
| 80 | 0.340 | \(-15.0\) | 0.905 | 5.89 | \(-0.41\) | |
| 85 | 0.337 | \(-16.2\) | 0.891 | 5.82 | \(-0.40\) | |
| 90 | 0.335 | \(-18.0\) | 0.867 | 5.72 | \(-0.39\) | |
| Density saturation count \(c_{\mathrm{sat}}\) | ||||||
| \(c_{\mathrm{sat}}\) | 1 | 0.348 | \(-14.7\) | 0.911 | 5.88 | \(-0.40\) |
| 2 | 0.340 | \(-15.0\) | 0.905 | 5.89 | \(-0.41\) | |
| 3 | 0.336 | \(-15.3\) | 0.903 | 5.90 | \(-0.41\) | |
| 4 | 0.334 | \(-15.3\) | 0.902 | 5.90 | \(-0.41\) | |
| 5 | 0.333 | \(-15.4\) | 0.901 | 5.91 | \(-0.41\) |
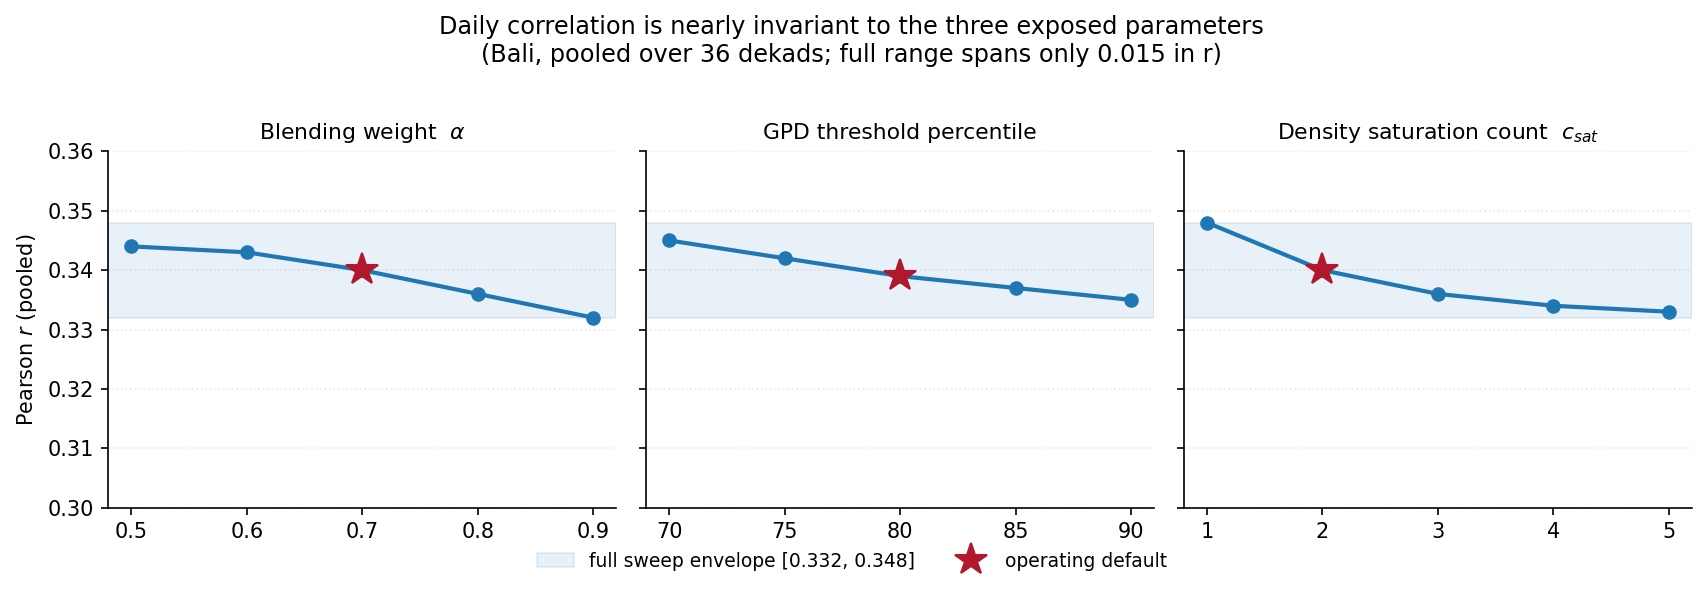
The \(r\) column of that table is the same data plotted three ways below. The shaded band is the full \([0.332, 0.348]\) envelope across all fifteen settings; the star marks each operating default. The curves are monotone and shallow: no single parameter moves the daily correlation by more than \(0.015\).
Headline finding
Three things follow from these fifteen settings:
- Every parameter produces a monotone, locally smooth response. None of the fifteen settings reverses the headline pattern that LSEQM+DL moves value adjustment, distribution alignment, and tail preservation toward the gauge target. The framework is stable under parameter perturbation in the explored range.
- Pearson \(r\) stays in the narrow band \([0.332, 0.348]\) across all fifteen settings, a spread of \(0.016\). No setting shifts the daily correlation by more than half a single-pixel sampling-uncertainty interval. This is the empirical expression of the theoretical bound discussed on the Validation page and in the companion paper (Remote Sens. 2026, 18, 2298): marginal correction methods are not designed to lift day-by-day timing skill.
- The amplitude metrics (RB, SDR, RMSE, NSE) shift coherently. Increasing \(\alpha\) pulls the corrected output toward the LSEQM intermediate (less CNN contribution); raising the GPD percentile pulls the upper tail down (RB widens negative, SDR compresses). Increasing \(c_{\mathrm{sat}}\) has the same direction as raising \(\alpha\) because both reduce the effective CNN weight.
How to read this for your own domain
The defaults were chosen against the full Indonesian domain and against the BMKG validation network. On a different region with a different gauge density or a different climatological regime, the defaults are a starting point rather than an answer. The sweep notebook is set up so that re-running it on a different subdomain is a configuration edit, not a code edit. See Config Recipes for the relevant config.yml keys.
Caveats
The three parameters are exposed as a sensitivity surface but not as a formally optimised set. A joint Cartesian-grid search with a strict temporal hold-out would refine the defaults; this is on the backlog and is identified as a methodological direction in the companion paper.
See also
- Validation - how the framework was validated against held-out BMKG stations on the full-Indonesia run.
- Testing - what the automated test suite covers.
- Companion paper
- Master’s thesis Chapter 4.8 (full sensitivity discussion) and Chapter 5.5 (limitations).