PyCPT Tutorial
Rainfall, evidence and reproducible workflows
A practical guide to climate prediction
Rainfall forecasts,
put to the test.
Explore PyCPT through a real Indonesia case. Learn what calibration changes, when a simple climatology forecast does better, and how to reproduce the evidence.
Read in your browser. Run the companion notebooks when you are ready.
Choose your way in
You can follow the findings, work through the code, or prepare your environment.
01 / Learn
Learn PyCPT step by step
Set up a case, download hindcasts and observations from the IRI Data Library, bring your own observations, fit CCA with evaluate_models, read its probabilities, combine seven models and adapt it all to your own region. Every page is an executed notebook with real data.
02 / Read
Follow the story
Explore interactive charts and maps. Compare CCA, PCR, the raw model and climatology, including the seasons where calibration falls short.
03 / Reproduce
Work through the notebook
Follow the executed steps, inspect the calculations and use the saved data bundle to reproduce the figures and scores offline.
04 / Get ready
Set up your workspace
Check the requirements, download the complete tutorial kit and choose between offline analysis and the optional PyCPT model-fitting workflow.
Case 01 · Seasonal rainfall · Ready to explore
Twelve seasons over Indonesia
Does statistical calibration improve a rainfall forecast? Follow twelve overlapping three-month windows centred on 2023, from the national comparison to province-weighted outcomes. OND provides the worked example.
Full Indonesia
National and province views
CCA · PCR · Raw · Climatology
Four methods, one observation reference
Story + executed notebook
Figures, code and NetCDF downloads
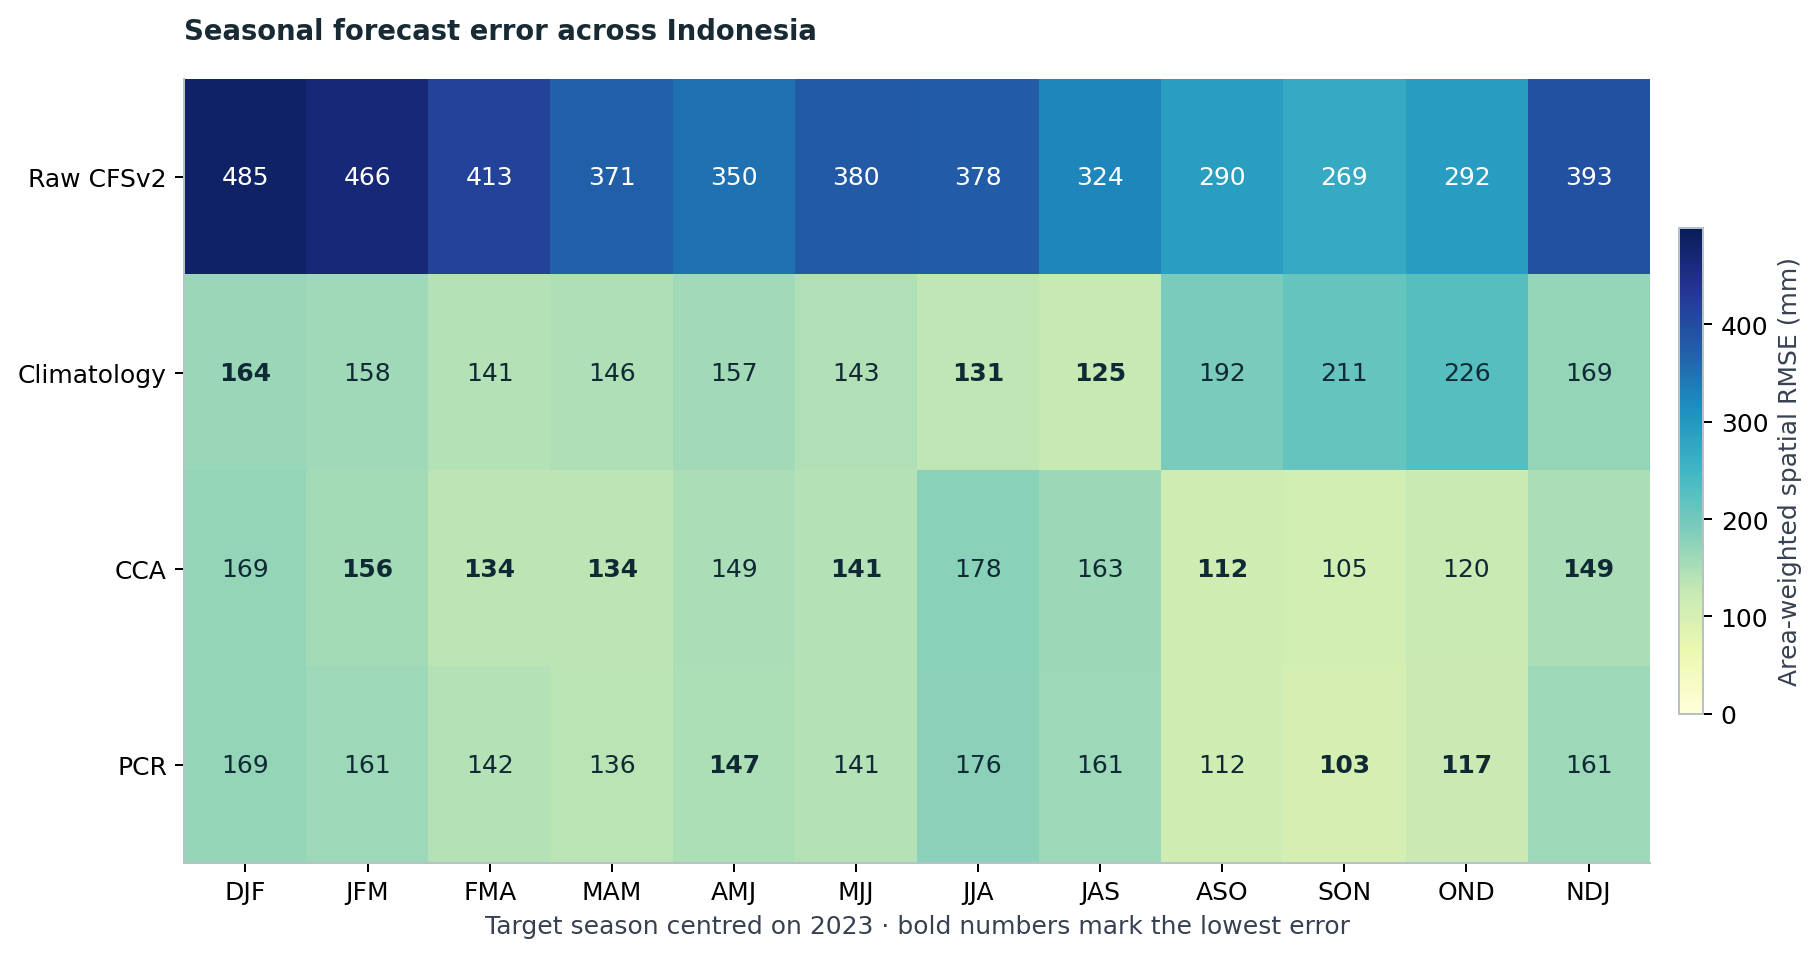
A preview from the executed notebook. The story adds interactive exploration; PNG and SVG downloads let you take selected charts into your own work.
Case 02 · Fitting and diagnostics · Ready to explore
From rainfall inputs to a calibrated forecast
Run the workflow behind the maps. Follow four actual PyCPT fits for OND and JJA 2023, inspect model patterns and cross-validated residuals, and compare the forecasts with a simple climatology baseline. The inputs are local and traceable.
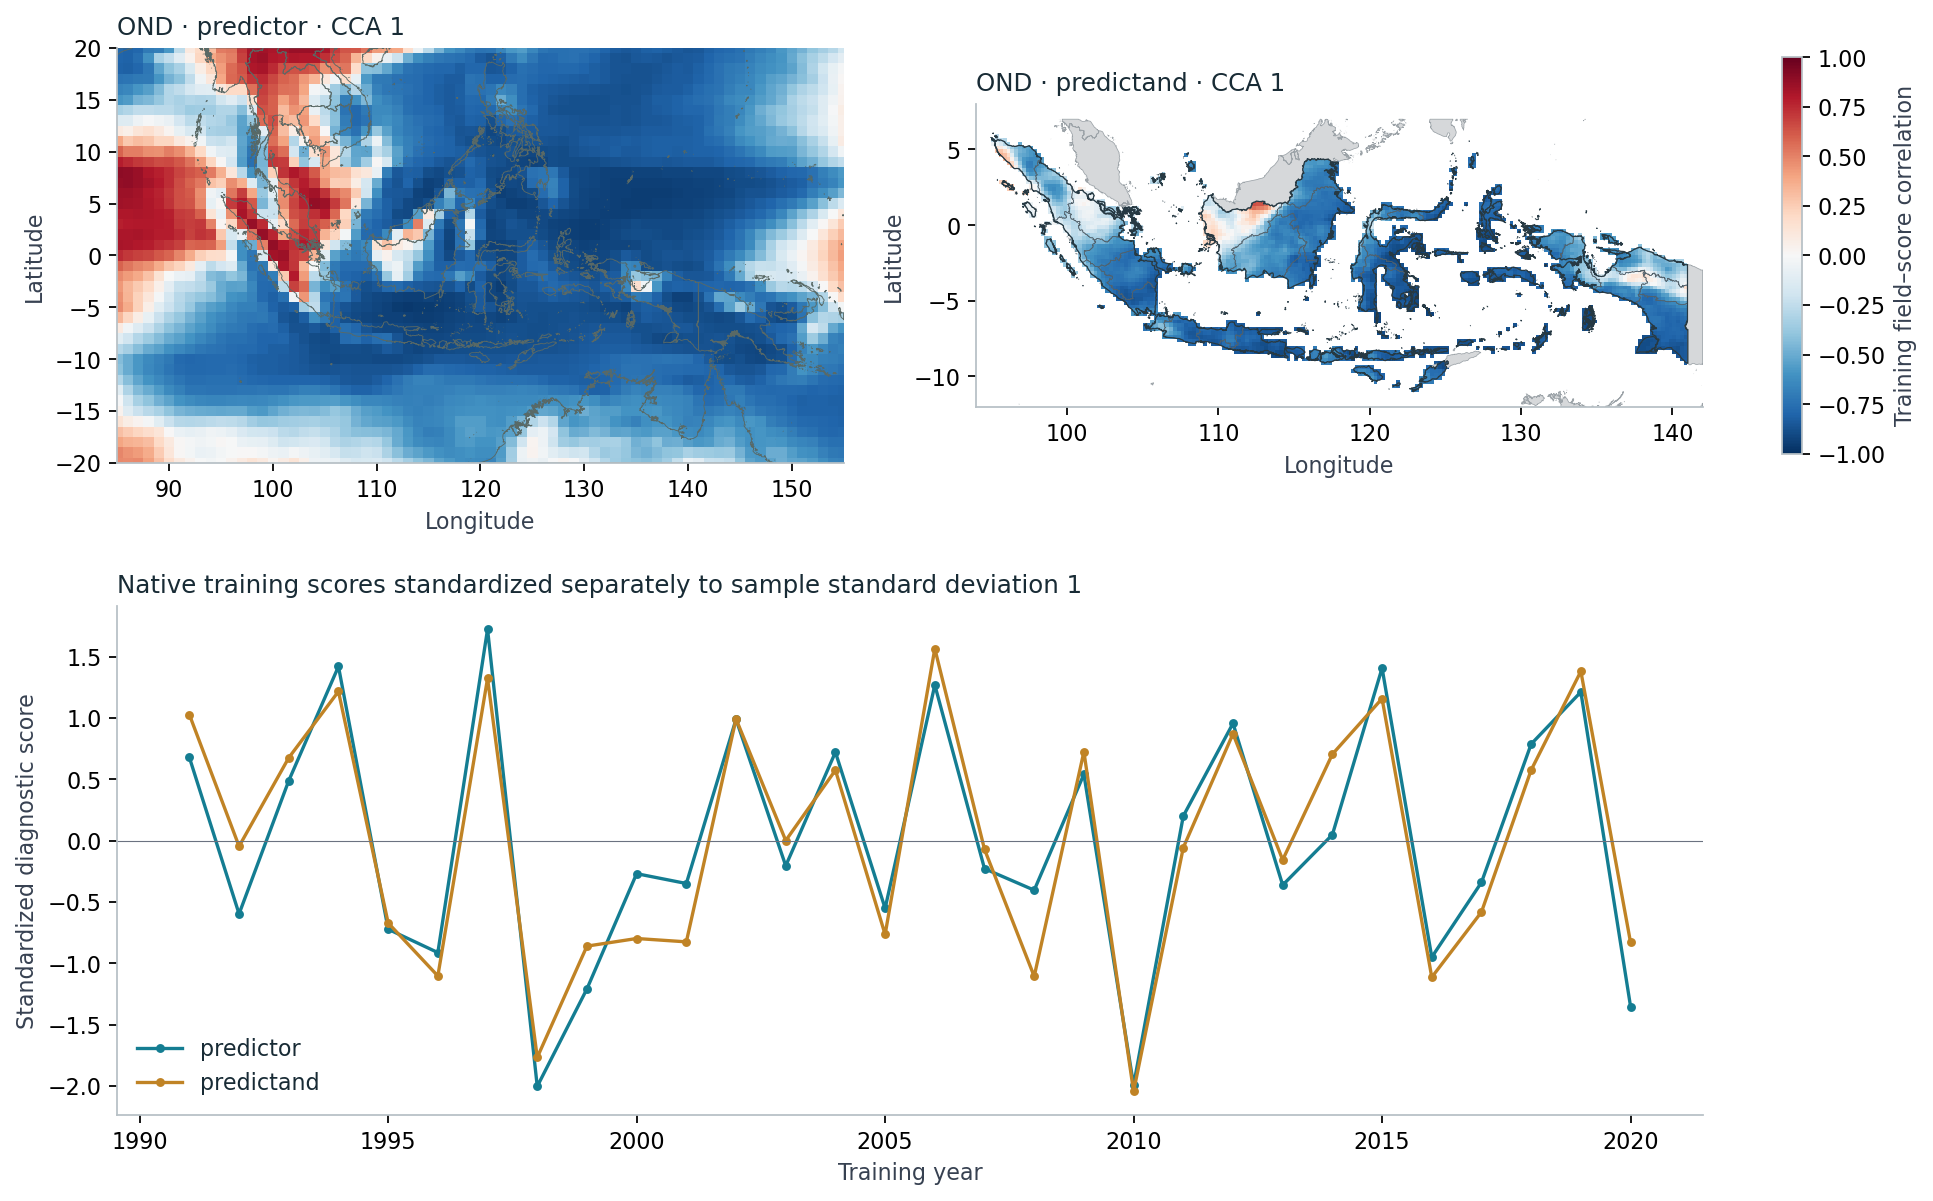
Training patterns describe fitted relationships. The story pairs them with separate forecast errors and explains what each diagnostic can establish.
Cases 03 to 07 · Lead time · Seasonal and subseasonal rainfall at 0.05°
How far ahead?
Forecasts issued around 1 November 2023 for what comes next: CFSv2 for each of the next six months and six seasons, GEFSv12 for the next three dekads, four weeks and six pentads. Skill by lead for CCA, PCR and the raw model, and each forecast against what happened.
Learn the workflow behind the figure
The tutorial connects forecast maps to observations, baselines, calendars and verification. Every case pairs an accessible story with an executed notebook and traceable inputs. All cases are retrospective learning examples; their results do not establish operational forecast skill or probability reliability.
How to use this tutorial · About the project and its sources
Who made this
PyCPT Tutorial is a casual weekend project by Benny Istanto, written to learn PyCPT in the open with real data. Corrections are welcome through the issue tracker.
Independent project
This tutorial is not affiliated with, endorsed by or maintained by the International Research Institute for Climate and Society (IRI) or the developers of PyCPT and CPT. PyCPT, CPT and the IRI Data Library are their work; see About & credits for the upstream sources.