Fit CCA with evaluate_models, read what it returns, and check it
evaluate_models is the step that calls CPT. It fits the calibration, produces cross-validated hindcasts, a forecast for 2023 and skill maps, and writes them to the case folder. This chapter runs it on the inputs from chapters 2 and 3, then looks closely at what each returned number is, because the returned objects mix results of different kinds.
NoteWhat you need to run this page
The full PyCPT environment with its CPT engine, and the case folder from chapters 1 to 3. No data is downloaded: PyCPT reuses the files already in the folder.
1. Load the inputs
The settings are the ones from chapter 1. The predictor files come from chapter 2 and the predictand is the local CHIRPS v3.0 file built in chapter 3.
from pathlib import Pathimport datetime as dtimport inspectimport sysimport timeimport matplotlib.pyplot as pltimport numpy as npimport pandas as pdimport xarray as xrfrom IPython.display import Image, displayimport pycptfrom pycpt import notebook as pycpt_notebookrepo =next((p for p in (Path.cwd(), *Path.cwd().parents) if (p /"pycpt_tutorial").is_dir()), None)sys.path.insert(0, str(repo))from pycpt_tutorial import figuresfigures.use_style()MOS ="CCA"predictor_names = ["CFSv2.PRCP"]predictand_name ="CHIRPS3.PRCP"download_args = {"fdate": dt.datetime(2023, 9, 1),"target": "Oct-Dec","target_first_year": 1991,"target_final_year": 2020,"predictor_extent": {"west": 85, "east": 155, "south": -20, "north": 20},"predictand_extent": {"west": 94, "east": 142, "south": -12, "north": 7},}cpt_args = {"transform_predictand": None,"tailoring": None,"cca_modes": (2, 2),"x_eof_modes": (3, 3),"y_eof_modes": (3, 3),"validation": "crossvalidation","drymask_threshold": None,"skillmask_threshold": None,"crossvalidation_window": 5,"synchronous_predictors": True,}force_download =Falsecase_dir = Path.home() /"PyCPT"/"indonesia-ond-2023-sep-init"domain_dir = pycpt.setup(case_dir, download_args["predictor_extent"])local_predictand_file = domain_dir /"data"/"local-CHIRPS3-OND-1991-2020.nc"Y, hindcast_data, forecast_data = pycpt.download_data( predictand_name, local_predictand_file, predictor_names, download_args, domain_dir, force_download)
Input data will be saved in ~/PyCPT/indonesia-ond-2023-sep-init/85W-155E_to_-20S-20N/data
Figures will be saved in ~/PyCPT/indonesia-ond-2023-sep-init/85W-155E_to_-20S-20N/figures
Output will be saved in ~/PyCPT/indonesia-ond-2023-sep-init/85W-155E_to_-20S-20N/output
Reusing already-downloaded CFSv2.PRCP_f2023

Using local observed predictand dataset
Reusing already-downloaded CFSv2.PRCP
The predictand is named CHIRPS3.PRCP here, not CHIRPS3 (local) as in chapter 3. For a local file the name is only a label, but step 7 shows that one plotting function reads it.
2. What evaluate_models does
Before running it, read it. For CCA, the installed PyCPT 2.10.4 source does the following for each model:
source = inspect.getsource(pycpt_notebook.evaluate_models).splitlines()start =next(i for i, line inenumerate(source) if"if str(MOS).upper() == 'CCA'"in line)end =next(i for i, line inenumerate(source) if"elif str(MOS).upper() == 'PCR'"in line)for number inrange(start, end):if source[number].strip():print(f"{number +1:4d} | {source[number]}")
  24 |         if str(MOS).upper() == 'CCA':
  26 |             # fit CCA model between X & Y and produce real-time forecasts for F
  27 |             cca_h, cca_rtf, cca_s, cca_px, cca_py = cc.canonical_correlation_analysis(
  28 |                 model_hcst, Y, F=forecast_data[i], **cpt_args
  29 |             )
  31 |             # fit CCA model again between X & Y, and produce in-sample probabilistic hindcasts
  32 |             # this is using X in place of F, with the year coordinates changed to n+100 years
  33 |             # because CPT does not allow you to make forecasts for in-sample data
  34 |             cca_h, cca_f, cca_s, cca_px, cca_py = cc.canonical_correlation_analysis(
  35 |                 model_hcst, Y, \
  36 |                 F=ce.redate(model_hcst, yeardelta=48), **cpt_args
  37 |             )
  38 |             cca_h = xr.merge([cca_h, ce.redate(cca_f.probabilistic, yeardelta=-48), ce.redate(cca_f.prediction_error_variance, yeardelta=-48)])
  40 |             # use the in-sample probabilistic hindcasts to perform probabilistic forecast verification
  41 |             # warning - this produces unrealistically optimistic values
  42 |             cca_pfv = cc.probabilistic_forecast_verification(cca_h.probabilistic, Y, **cpt_args)
  43 |             cca_s = xr.merge([cca_s, cca_pfv])
  45 |             hcsts.append(cca_h)
  46 |             fcsts.append(cca_rtf)
  47 |             skill.append(cca_s.where(cca_s > -999, other=np.nan))
  48 |             pxs.append(cca_px)
  49 |             pys.append(cca_py)
Read it as three steps:
First fit. CCA on X and Y with F set to the real 2023 forecast input. Only the forecast from this call (cca_rtf) is kept.
Second fit. The same CCA again, but F is the training predictor X itself, shifted forward by 48 years with cptextras.redate so CPT will accept it as “future” input. (The comment above the call says 100 years; the code passes yeardelta=48.) The probabilities and prediction-error variance from this call are shifted back and merged into the hindcasts. They are probabilities for years the model was trained on.
Probabilistic scores are computed from those in-sample probabilities. The source’s own comment says this “produces unrealistically optimistic values”.
The second call also replaces the first call’s hindcasts, skill and patterns. Its cross-validation uses the same X, Y and settings as the first.
probabilistic_forecast_verification on the in-sample probabilities
optimistic: the template labels generalized_roc and rank_probability_skill_score “in sample”; ignorance comes from the same call
pxs, pys
patterns from the full training period
diagnostics, not skill
The template plots the six deterministic metrics. Chapter 5 returns to the probabilities.
The claim that the deterministic scores describe the cross-validated hindcasts can be checked directly: recompute the Pearson correlation and the RMSE between hcsts.deterministic and the observations at every cell, and compare them with CPT’s maps.
pearson: largest difference from CPT's map 0.0000 over 3240 cells
root_mean_squared_error: largest difference from CPT's map 0.0013 over 3240 cells
6. Compare with the Fit & diagnose case
The Fit & diagnose case ran the same CCA settings through cptcore directly. Chapter 3 showed the predictand is identical. Chapter 2 showed the predictor is not: PyCPT’s CFSv2 totals weight the three months equally, while the case weighted them by days, with differences up to 8.25 mm. The table measures how much that changes the results, over the 3,240 predictand cells.
controls = repo /"docs/data/fitting-2023/controls"control_forecast = xr.open_dataset(controls /"OND-cca-forecasts.nc")control_hindcast = xr.open_dataset(controls /"OND-cca-hindcasts.nc")control_skill = xr.open_dataset(controls /"OND-cca-native_skill.nc")cells = Y.notnull().all("T")def compare(label, ours, theirs): ours = ours.reindex(X=theirs["X"], Y=theirs["Y"], method="nearest", tolerance=1e-3).where(cells) a = ours.transpose(*theirs.dims).values b = theirs.values gap = np.abs(a - b)return {"result": label, "units": theirs.attrs.get("units", ""),"largest difference": float(np.nanmax(gap)),"mean difference": float(np.nanmean(gap)),"median of the case's values": float(np.nanmedian(np.abs(b)))}rows = [compare(f"2023 forecast: {v}", fcsts[0][v], control_forecast[v]) for v in control_forecast.data_vars]rows.append(compare("CV hindcasts: deterministic", hcsts[0].deterministic, control_hindcast.deterministic))rows += [compare(f"skill: {v}", skill[0][v], control_skill[v]) for v in control_skill.data_vars]pd.DataFrame(rows).set_index("result").round(4)
units
largest difference
mean difference
median of the case's values
result
2023 forecast: deterministic
mm
0.0235
0.0066
617.5582
2023 forecast: probabilistic
probability (%)
0.0410
0.0057
24.1579
2023 forecast: prediction_error_variance
mm (squared)
539.3447
29.2053
30431.3300
CV hindcasts: deterministic
mm
2.5542
0.2239
783.1758
skill: pearson
0.0019
0.0004
0.5883
skill: spearman
0.0227
0.0011
0.5842
skill: two_alternative_forced_choice
0.9195
0.0619
70.8046
skill: roc_area_below_normal
0.0150
0.0005
0.8150
skill: roc_area_above_normal
0.0106
0.0007
0.7350
skill: root_mean_squared_error
0.4358
0.0578
150.9366
The predictor difference measured in chapter 2 moves the results only slightly: the 2023 deterministic forecast changes by hundredths of a millimetre, the cross-validated hindcasts by up to a few millimetres, and the skill scores by small fractions of their scales. The high-level evaluate_models path and the direct cptcore path agree to the extent the inputs agree.
7. Plot the results
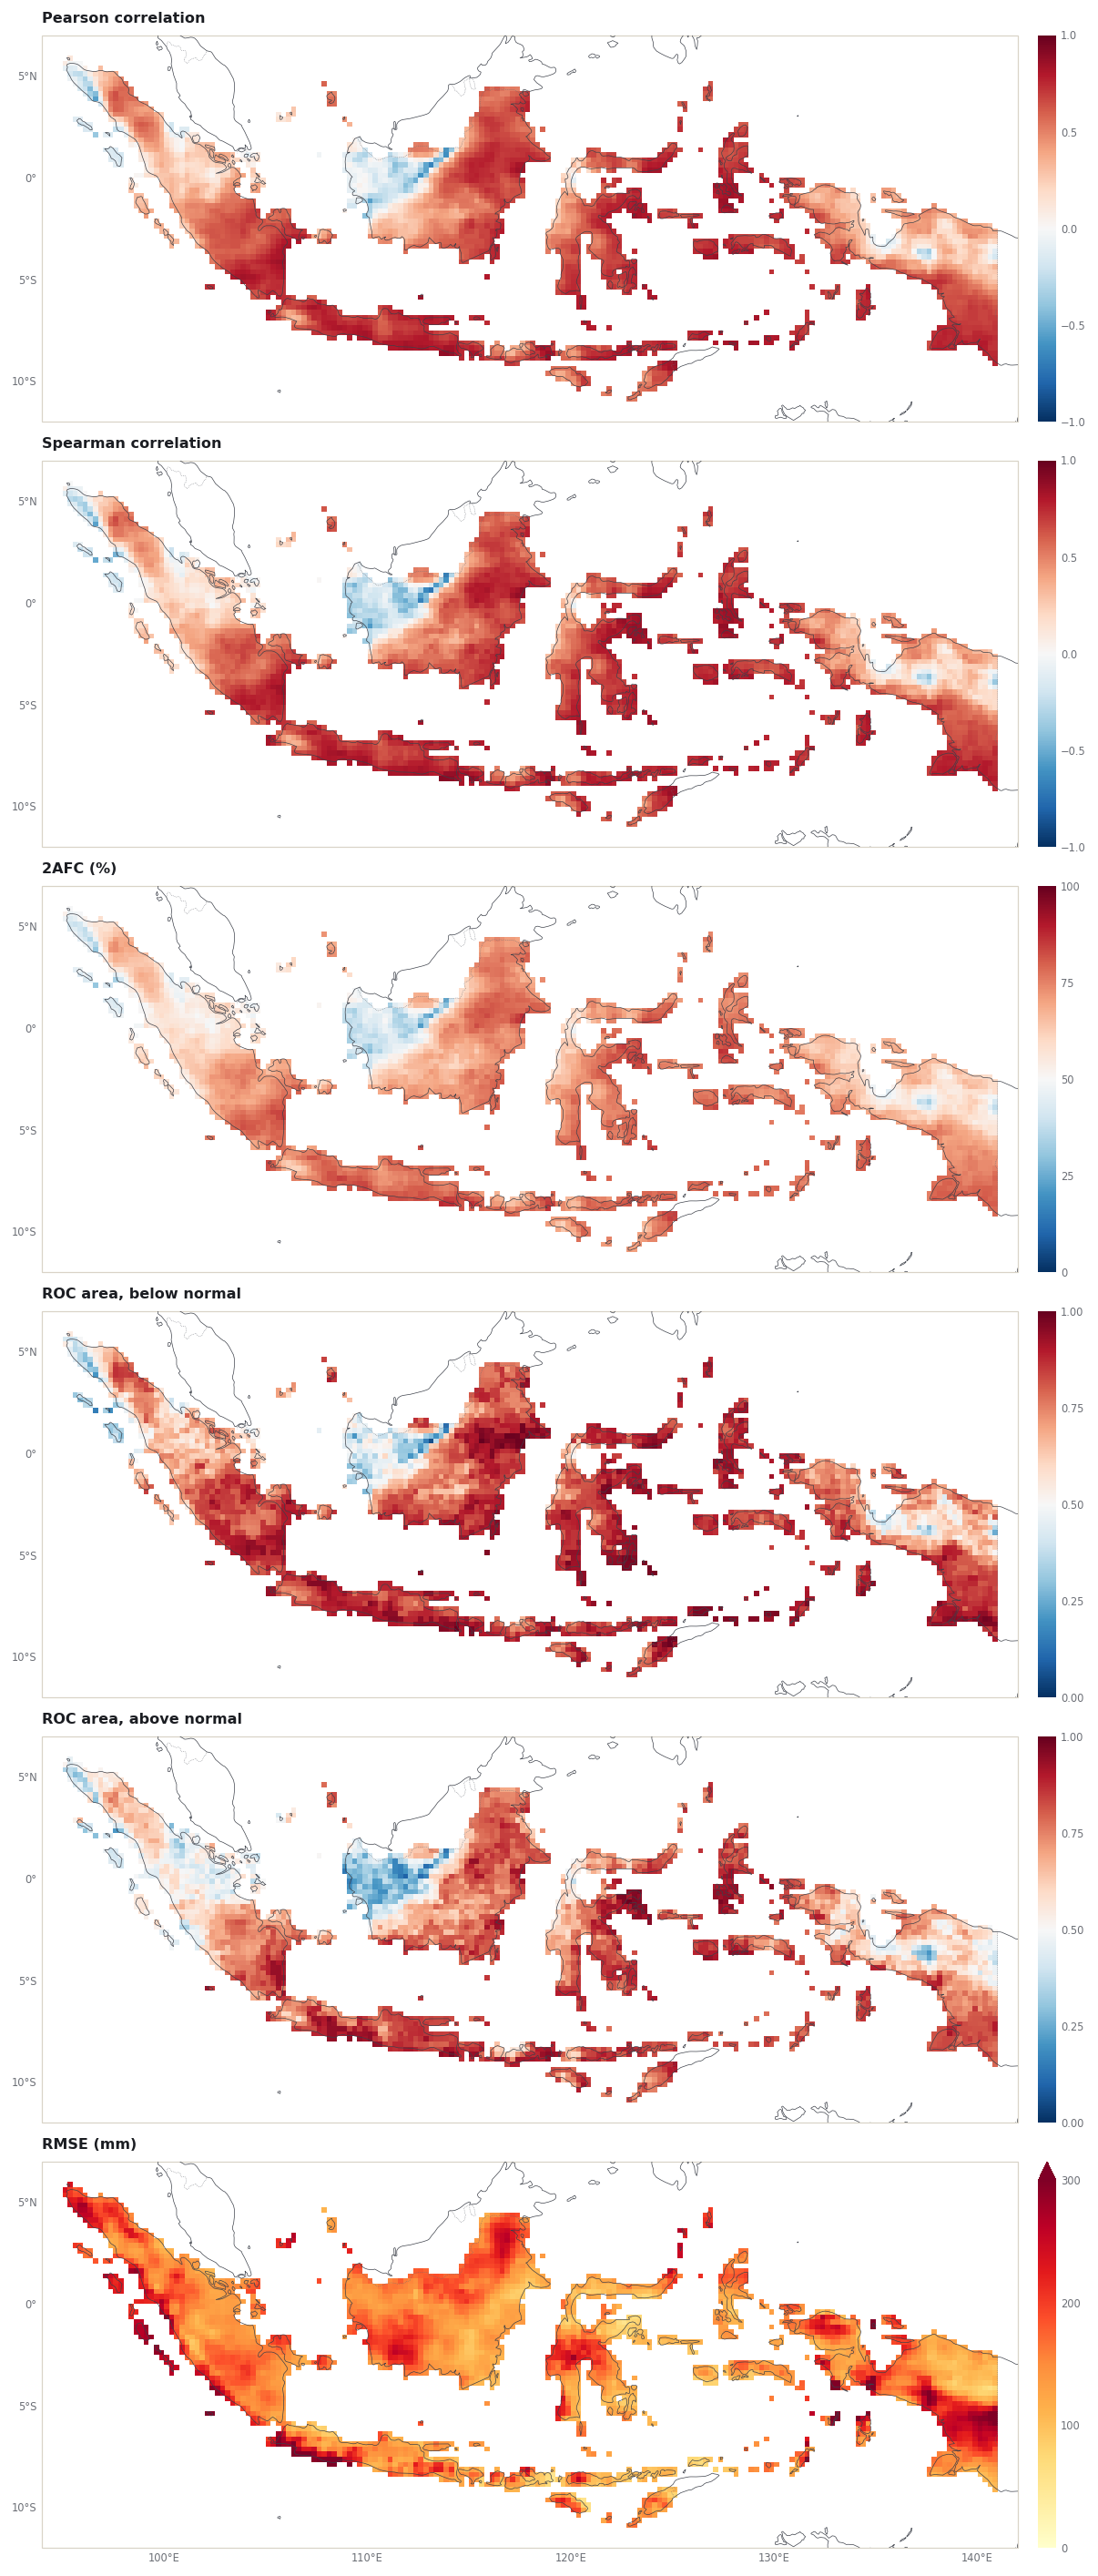
PyCPT has four plotting functions for these results: plot_skill, plot_eof_modes, plot_cca_modes and plot_forecasts. Each saves PNG files in the case’s figures/ folder. This chapter runs all four so those files exist, but draws the figures on the page with the tutorial’s figure helper from the same returned data, in one consistent style. figures.quiet_pycpt_plots() stops PyCPT from also drawing its versions inline; it does not change what PyCPT saves.
Skill maps
plot_skill takes the list of metric names to draw. These are the template’s six deterministic metrics. The colour ranges below are the ones PyCPT uses for them.
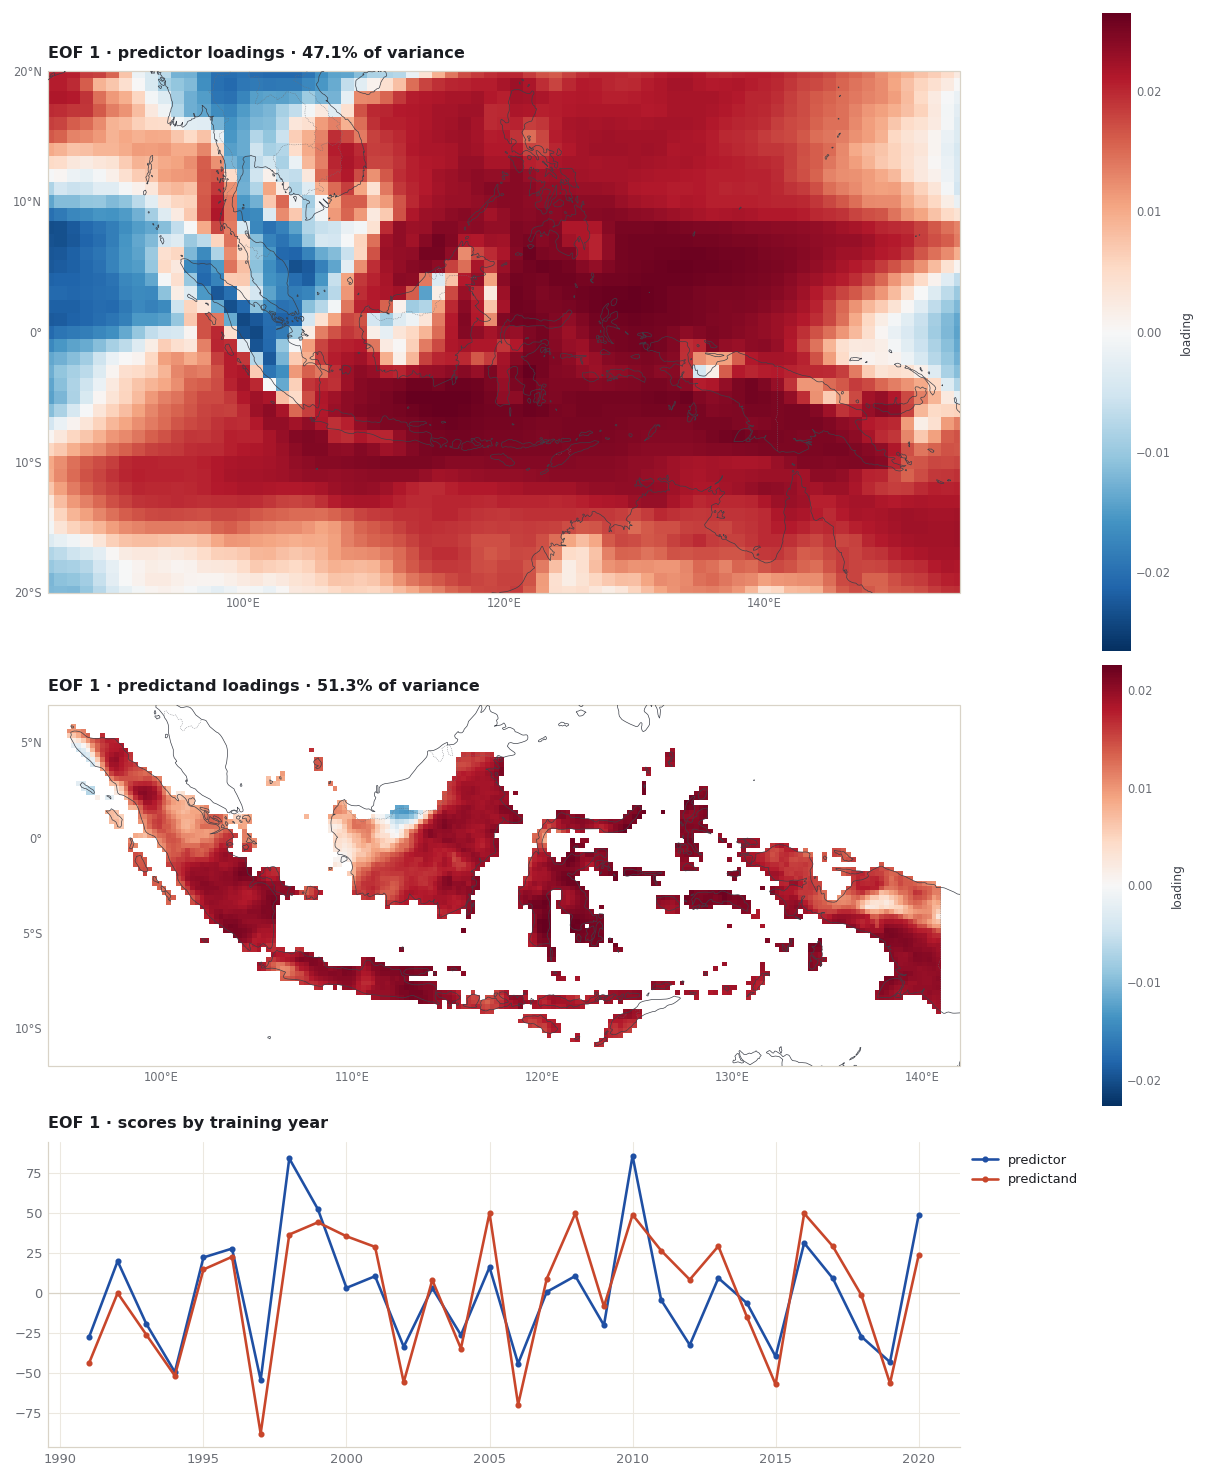
The pattern plots draw a fixed number of modes: in PyCPT 2.10.4, plot_eof_modes sets nmodes = 5 and plot_cca_modes sets nmodes = 3. This case keeps 3 EOFs and 2 CCA modes, so the cell below first checks which modes contain values.
x_patterns, y_patterns = pxs[0], pys[0]for label, a in [("predictor EOF", x_patterns.x_eof_loadings), ("predictor CCA", x_patterns.x_cca_loadings), ("predictand EOF", y_patterns.y_eof_loadings), ("predictand CCA", y_patterns.y_cca_loadings)]: filled = [int(m) for m in a["Mode"].values ifint(a.sel(Mode=m).notnull().sum()) >0]print(f"{label:>15} modes with values: {filled}")print()print("Predictor explained variance, modes 1-5 (%):", np.round(x_patterns.x_explained_variance.values[:5], 2).tolist())print("Predictand explained variance, modes 1-5 (%):", np.round(y_patterns.y_explained_variance.values[:5], 2).tolist())
  predictor EOF modes with values: [1, 2, 3]
  predictor CCA modes with values: [1, 2]
 predictand EOF modes with values: [1, 2, 3]
 predictand CCA modes with values: [1, 2]

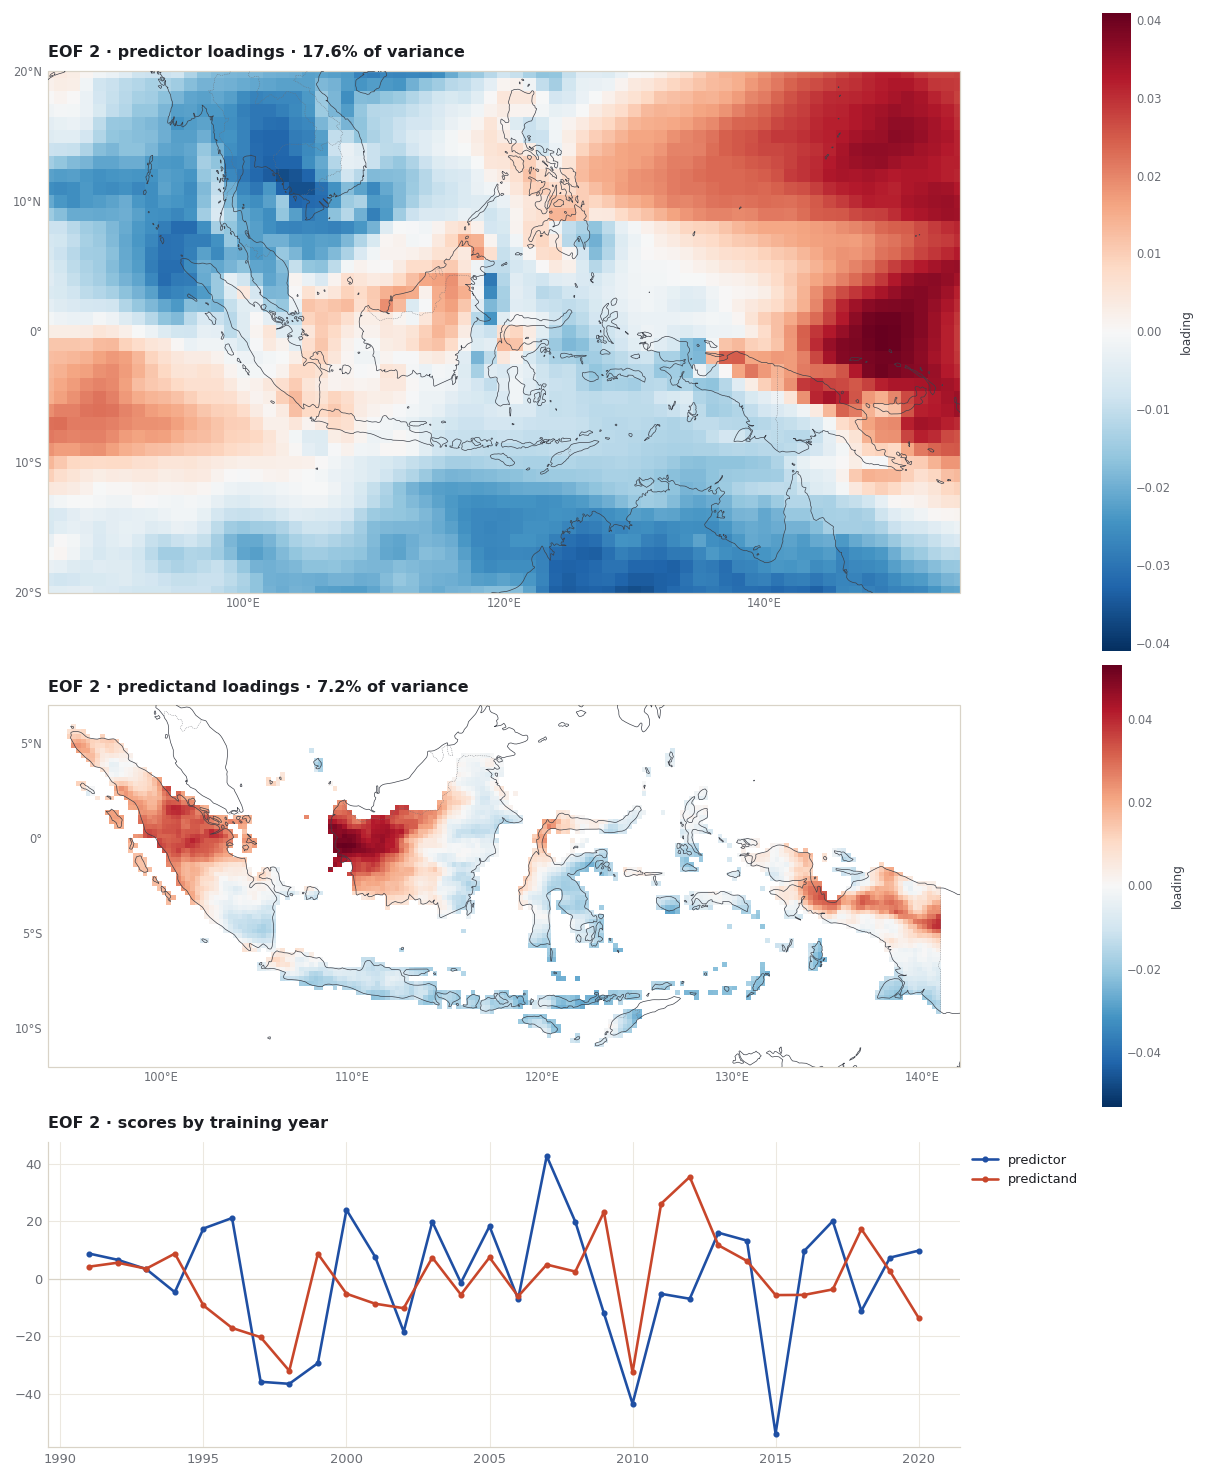
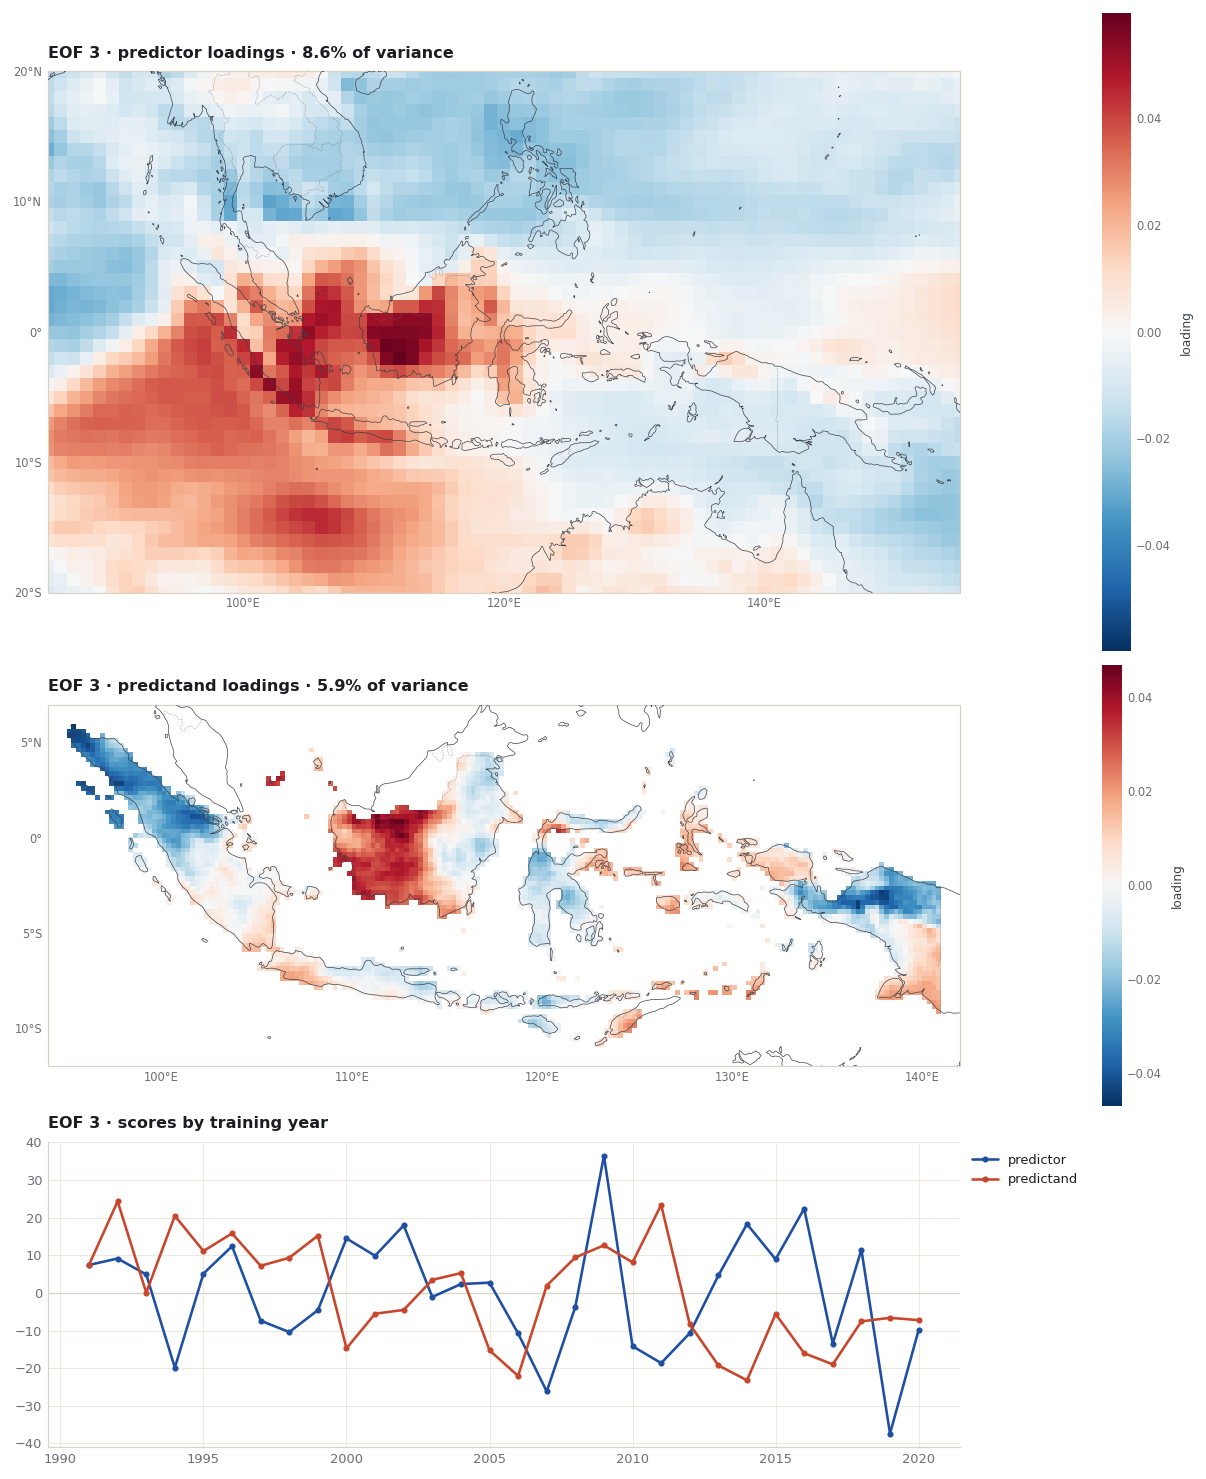
Predictor explained variance, modes 1-5 (%): [47.06, 17.62, 8.61, 4.74, 3.62]
Predictand explained variance, modes 1-5 (%): [51.33, 7.17, 5.85, 4.04, 3.61]
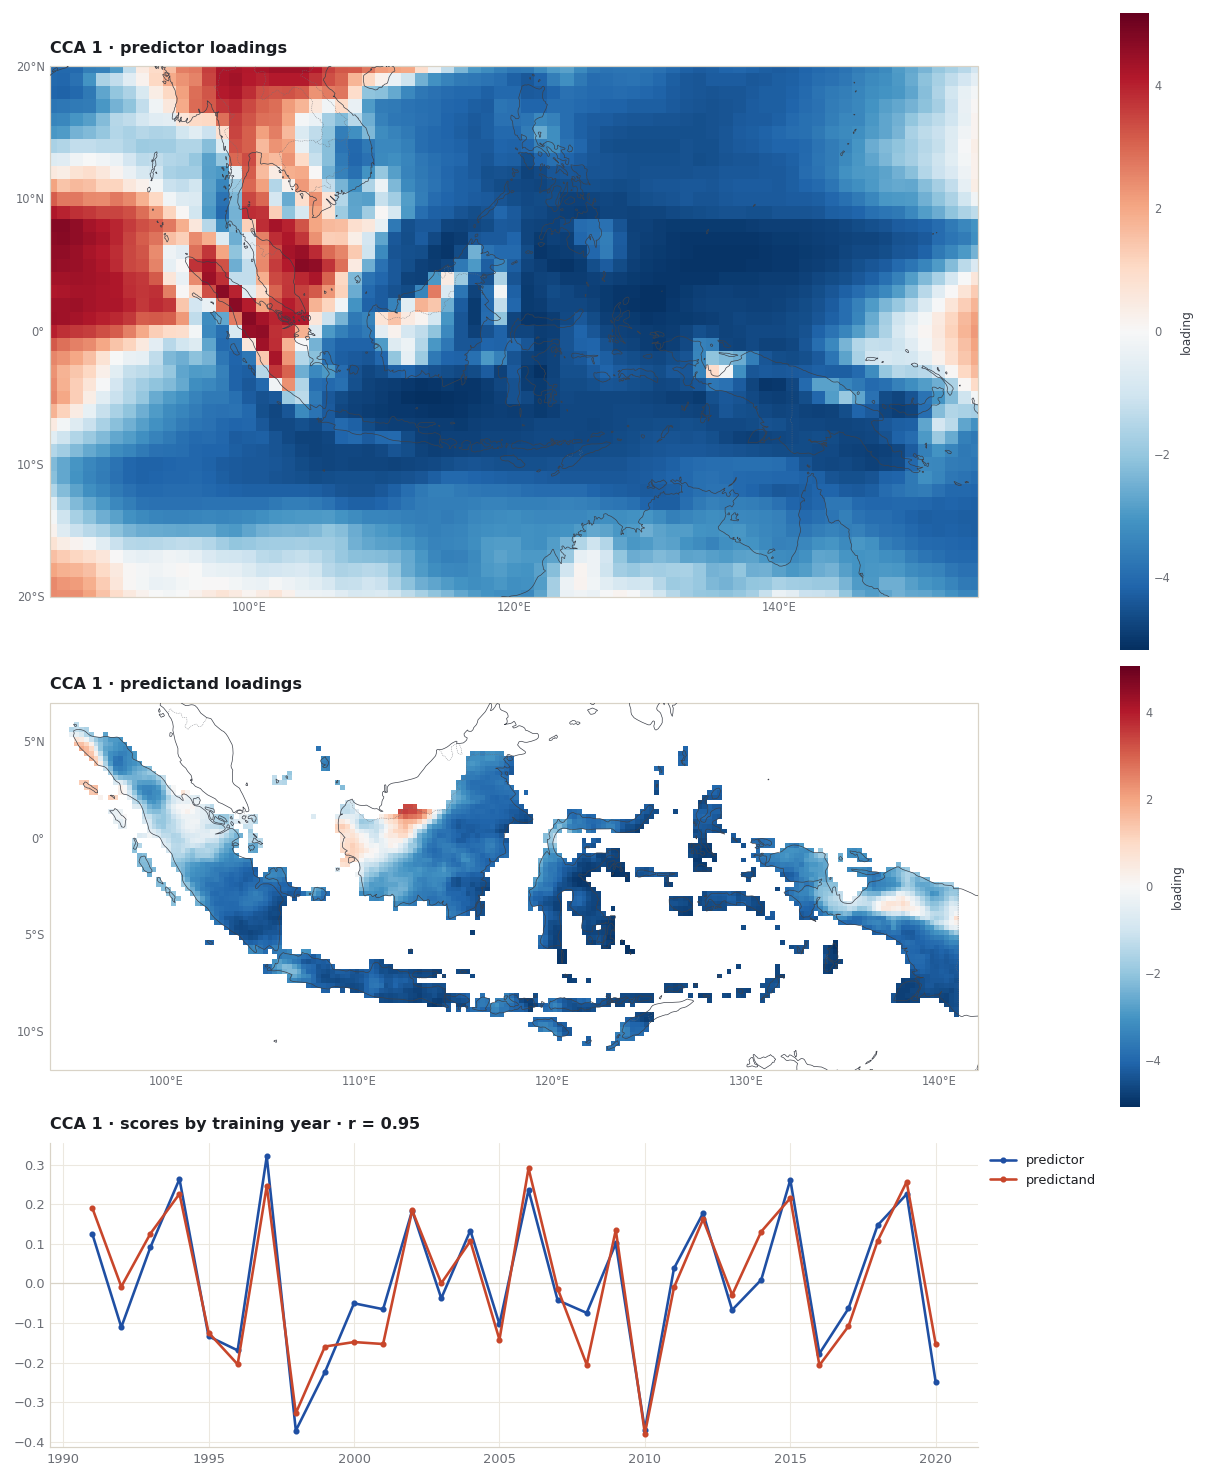
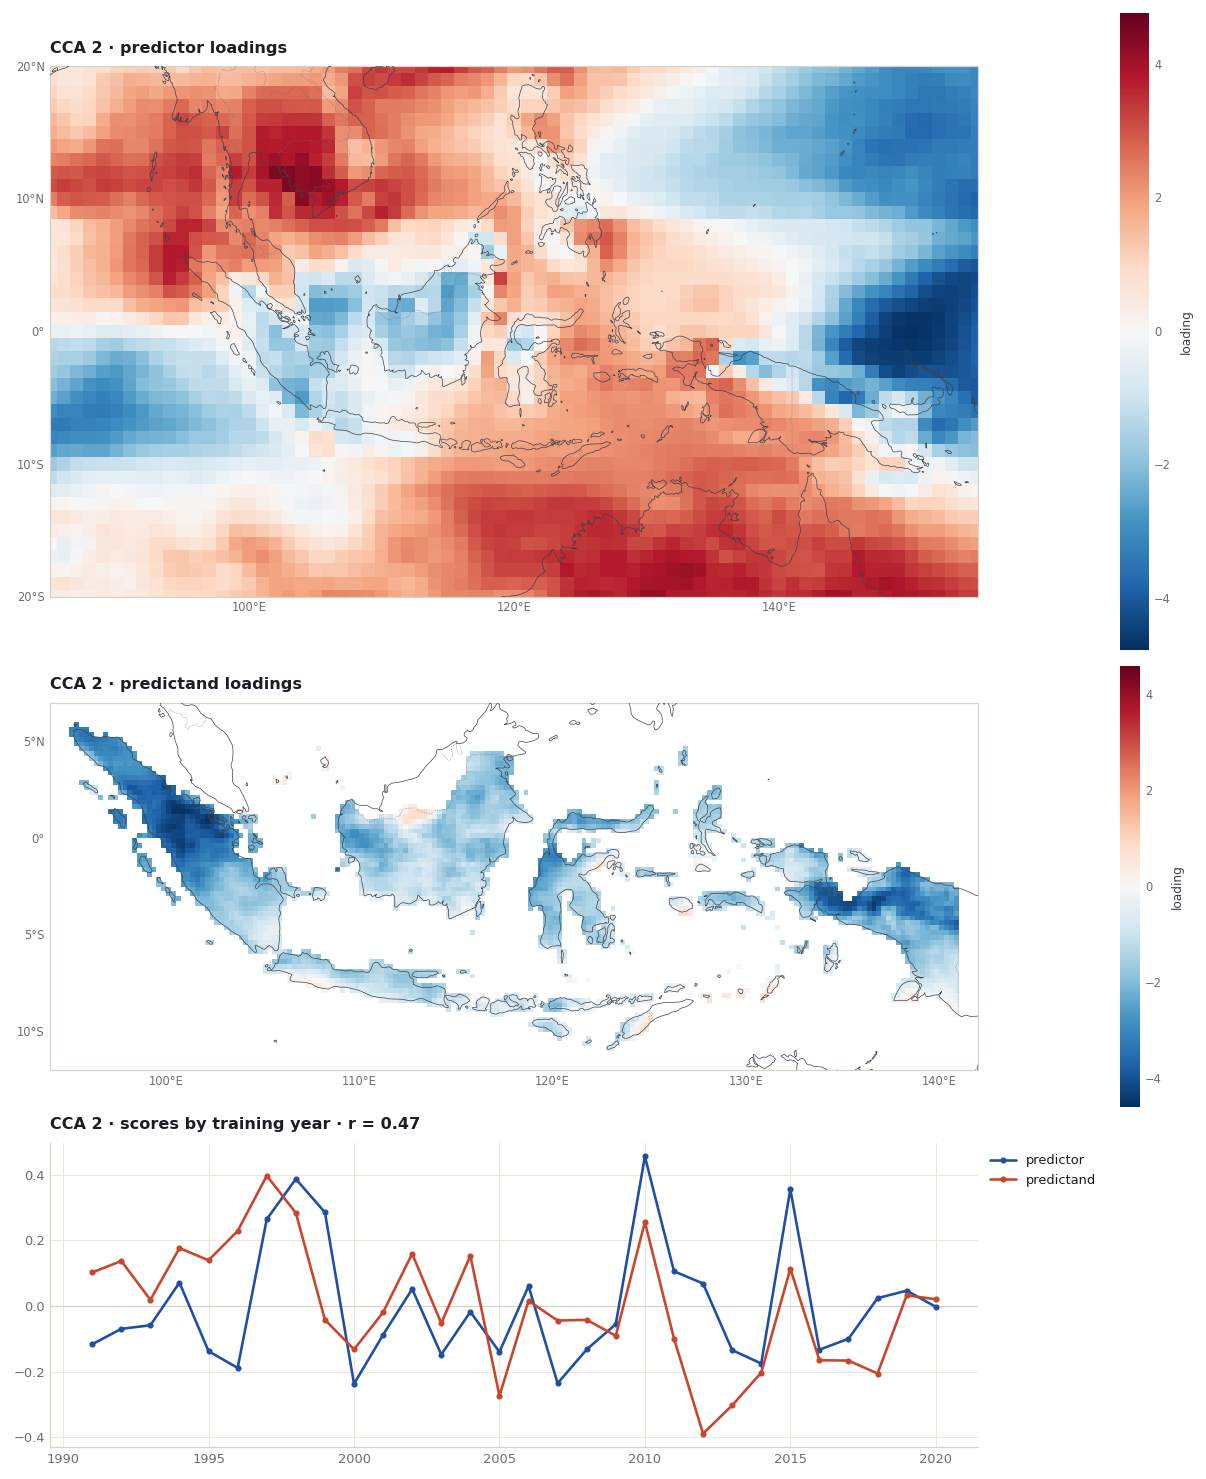
Only the retained modes have patterns; explained variance is reported for every mode, retained or not. PyCPT’s saved files therefore include empty ones: EOF modes 4 and 5, and CCA mode 3. The figures below draw the retained modes only: for each mode, the predictor loadings, the predictand loadings and the two time series of scores.
for mode in [1, 2]:
    figures.pattern_figure(x_patterns, y_patterns, "cca", mode, predictor_box, predictand_box)
    plt.show()
For CCA, the r in each title is the correlation between the predictor and predictand score series, computed in the figure from the returned scores. The sign of every mode is arbitrary: flipping both a pattern and its scores describes the same mode.
These are patterns fitted on the full training period. They show what the calibration uses; they are not evidence that the forecast is skilful.
The forecast
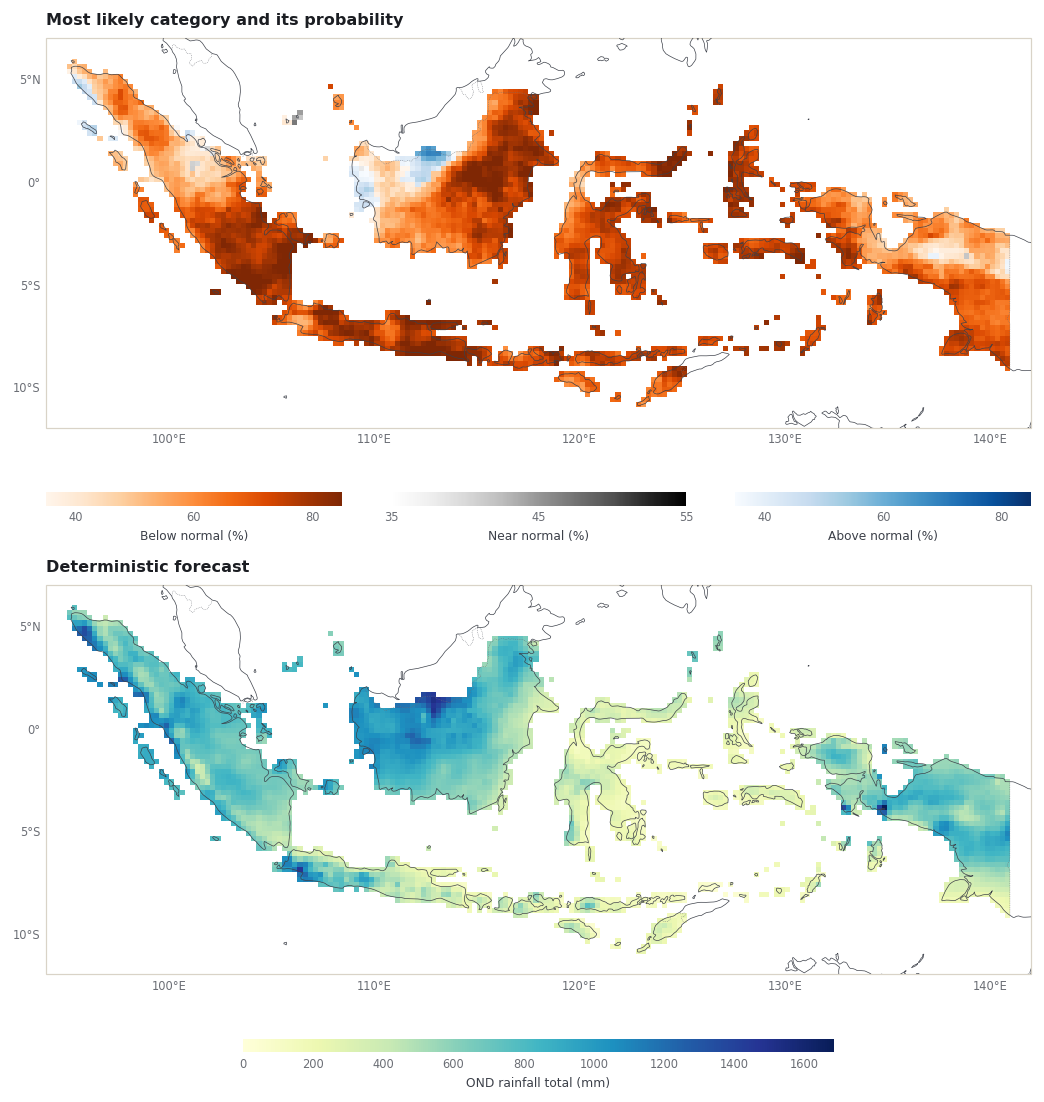
plot_forecasts chooses its colour scale by searching the predictand name for PRCP or a temperature code. In PyCPT 2.10.4, a name without one of them leaves the scale undefined and the function stops with an UnboundLocalError; with CHIRPS3 (local) as the name, it did. That is why this chapter uses CHIRPS3.PRCP.
The left map follows PyCPT’s own rule for this view (view_probabilistic in cptextras): each cell shows the category with the highest probability, coloured by that probability. Category index 0 is below normal, 1 near normal and 2 above normal, and the colour ranges, 35-85% for below and above normal and 35-55% for near normal, are the ones PyCPT uses. The right map is the deterministic forecast in mm. Chapter 5 explains how CPT defines the categories and what the probabilities mean.
print("Figures written to figures/:")for f insorted((domain_dir /"figures").iterdir()):print(f" {f.name}")
Figures written to figures/:
  CCA_CFSv2.PRCP_CCA_mode_1.png
  CCA_CFSv2.PRCP_CCA_mode_2.png
  CCA_CFSv2.PRCP_CCA_mode_3.png
  CCA_CFSv2.PRCP_EOF_mode_1.png
  CCA_CFSv2.PRCP_EOF_mode_2.png
  CCA_CFSv2.PRCP_EOF_mode_3.png
  CCA_CFSv2.PRCP_EOF_mode_4.png
  CCA_CFSv2.PRCP_EOF_mode_5.png
  CCA_CFSv2.PRCP_[determinstic-probabilistic]-Forecast.png
  CCA_models_skillMatrices.png
  Test.png
Test.png is a working file that plot_forecasts writes and leaves behind; it is safe to ignore.
What you have now
A CCA fit through PyCPT’s own evaluate_models, with its outputs in the case folder.
A map of which returned numbers are cross-validated, which are in-sample and which are the 2023 forecast.
A measured comparison with the Fit & diagnose case: same predictand, slightly different predictor, small differences in the results.
PyCPT’s four plot functions and the files they save, with two things to watch: empty files for modes that were not retained, and the predictand name.
The same results drawn as skill maps, retained patterns and a forecast map.
The next chapter looks at the probabilistic forecast: tercile categories, CPT’s native probabilities and PyCPT’s flexible forecasts.
CPT+. 430: Verification (CPT help). https://cptplus.org/Help/Tools_Verify.html Same page name as on the former cpthelp.iri.columbia.edu, which did not resolve when checked on 10 November 2026.
Saha, S., Moorthi, S., Wu, X., et al. (2014). The NCEP Climate Forecast System Version 2. Journal of Climate, 27(6), 2185-2208. https://doi.org/10.1175/JCLI-D-12-00823.1
Climate Hazards Center, UC Santa Barbara. CHIRPS: Rainfall Estimates from Rain Gauge and Satellite Observations (CHIRPS version 3.0 page). https://www.chc.ucsb.edu/data/chirps3
Funk, C., Peterson, P., Landsfeld, M., et al. (2014). A quasi-global precipitation time series for drought monitoring. U.S. Geological Survey Data Series 832. https://doi.org/10.3133/ds832